Animation Screenplay Application |
  
|
Animation Screenplay Application |
|
This application is intended for making animations of 2D drawings and 3D models. Creation of the animation screenplay implies defining a dependency of several variable values in time. Such dependencies are introduced in the form of diagrams. Each diagram is represented in the time and variable value coordinates.
The animation functionality allows controlling parameter values and viewing or recording in a file the dynamically changing state of the model. The application is activated via the command "AP: External Applications".
If the application is running, then it can be called similar to other system commands:
Icon |
Ribbon |
|---|---|
|
Tools → Animation → Animation editor |
Keyboard |
Textual Menu |
|
Parameters > Animation editor |
Let's review the general scheme of using the application when creating an animation screenplay:
1. Forming diagrams of each variable's time dependency (defining the minimum and maximum values of the respective variable; setting points on the diagrams defining the variable values at specific moments in time).
2. Setting animation options and creating a multimedia file (*.avi).
3. Starting the animation and viewing the results. When forming an animation, the system defines the number of animation steps per the specified animation time range and increment. Then, the variable values are subsequently read from the created diagrams at each step, and the model is regenerated with the current set of parameters. The results of the animation can be recorded (if necessary) in a multimedia file (*.avi).
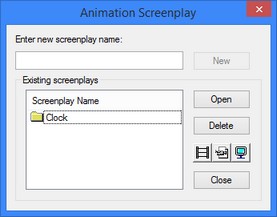
Note that the animation screenplay functionality is accessible only when the document has at least one variable that is not a textual (string) variable. A T-FLEX CAD document may contain several animation screenplays, defining the different ways of modifying variables. Upon calling the application, the dialog box is displayed on the screen for entering the name for a new screenplay ([New]) or selecting an existing one. If an existing screenplay is selected then the provided graphic buttons allow running, recording or reviewing the animation defined by this screenplay, or proceed with editing ([Open]) or deleting ([Delete]) the data.
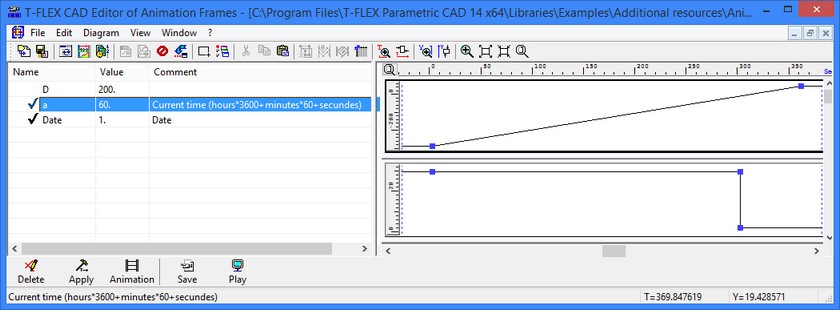
Editing of an animation screenplay is done in the dialog box "T-FLEX CAD Editor of Animation Frames". The dialog box is invoked by pressing the graphic button [Open]. The variations of each variable are defined as separate diagrams. The left pane of the dialog box keeps the list of the model variables, their values and comments. Driven variables (defined by a function or an expression) are displayed on a different background (particulars of handling those will be described below).
Creating new diagram
Click the desired line in the variable list with the mouse, and then select the following option in the context menu or under the "Diagram" menu entry:
![]() <Ins> Add Window With Diagram For Selected Variable
<Ins> Add Window With Diagram For Selected Variable
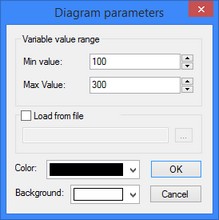
A dialog box will appear next for defining the diagram parameters. The default range of the variable values is set from Ѕ to 1Ѕ of its current value.
In future, the specified values can be modified using the option:
![]() <C> Set Diagram And Its Window Properties For Selected Variable
<C> Set Diagram And Its Window Properties For Selected Variable
The "Load from file" flag allows reading in an existing diagram saved in a file (*.tfg). The "Color" and "Background" define the color of the diagram and its background window. Upon confirming the diagram parameters, it's pane opens. The ruler on the left side of the diagram pane represents the scale for the variable values, while the one on the top side of the diagram pane reflects the time scale. Both scales reflect the defined range is of the values (the default time interval is from 0 to 60 seconds). At the beginning, the variable diagram is a constant equal to the current variable value. The user can now add an arbitrary number of points, defining the variation of the variable values along the specified time interval. If the screenplay already has another variable diagram in the window, then upon selecting a variable, the following option becomes available: |
|
![]() <G> Add Diagram For Selected Variable To Active Window
<G> Add Diagram For Selected Variable To Active Window
The current window is outlined by a frame, whose color is defined by the parameter "Active window color" per the option:
![]() Change Current Screenplay Name
Change Current Screenplay Name
To select the current window, point the mouse to the desired diagram and click ![]() . The option of adding a variable to the current window allows overlapping several diagrams in one coordinate space. If several diagrams are present in one window, the last modified diagram is considered selected. Its line is thicker, and the respective entry is highlighted in the list of a variables. A diagram sharing the window with other diagrams can be moved to a separate window using the option:
. The option of adding a variable to the current window allows overlapping several diagrams in one coordinate space. If several diagrams are present in one window, the last modified diagram is considered selected. Its line is thicker, and the respective entry is highlighted in the list of a variables. A diagram sharing the window with other diagrams can be moved to a separate window using the option:
![]() Move Active Diagram Into New Window
Move Active Diagram Into New Window
Adding/modifying diagram points
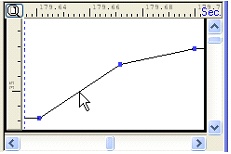
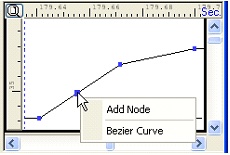
As the pointer moves inside the diagram window, its current coordinates are displayed in the lower right corner. Upon clicking ![]() , a new node is created under the pointer position, and is connected by straight segments with the neighboring points in the diagram. To create a new node dividing an existing segment of the diagram in the two, point the mouse to the diagram line and select the item "Add Node" from the context menu.
, a new node is created under the pointer position, and is connected by straight segments with the neighboring points in the diagram. To create a new node dividing an existing segment of the diagram in the two, point the mouse to the diagram line and select the item "Add Node" from the context menu.
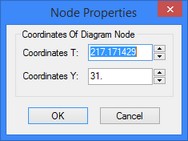
To modify the node position, point the mouse to it (the mouse pointer will change its appearance). Then, dragging the mouse with the |
|
![]() <M> Transfer Selected Nodes
<M> Transfer Selected Nodes
Upon selecting this option, a dialog box appears for inputting the shift values along the Т- and Y-axes. As a result, the selected group of points will change its position per the specified values.
Adding points to a diagram can also be done using the option:
![]() Cut Selected Nodes Of Active Diagram And Put Them Into Clipboard Or File
Cut Selected Nodes Of Active Diagram And Put Them Into Clipboard Or File
![]() Copy Selected Nodes Of Active Diagram Into Clipboard Or File
Copy Selected Nodes Of Active Diagram Into Clipboard Or File
![]() Paste Nodes With Positioning Into Active Diagram From Clipboard Or File
Paste Nodes With Positioning Into Active Diagram From Clipboard Or File
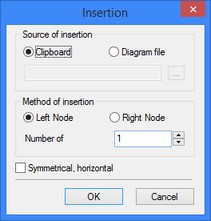
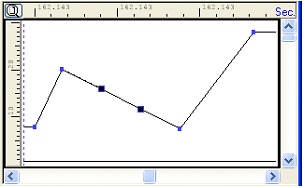
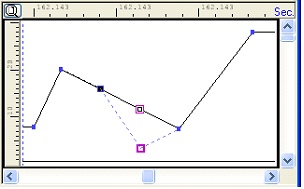
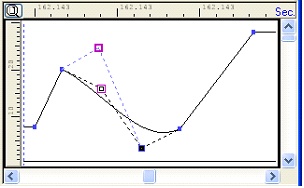
Use of these options implies existence of least one diagram with two nodes. Select several nodes (those will be highlighted) and pick one of the options, "Cut" or "Copy", in the control toolbar. Then select the fixing node for inserting the selected fragment of the diagram and pick the option "Paste". Thereafter, the "Insertion" dialog box appears. Besides the Clipboard, a source for insertion can be a diagram saved in a file (*.tfg). The insertion particulars are defined by the fixing node of the diagram fragment being inserted ("Left Node", "Right Node") and by the number of insertions. If the flag "Symmetrical, horizontal" is set, then the insertion fragment will be a copy of the original mirrored about the vertical line passing through the fixing node. |
|
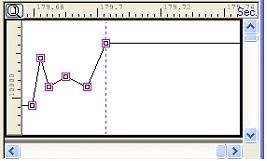
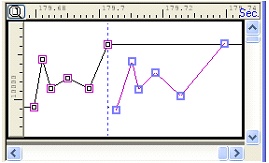
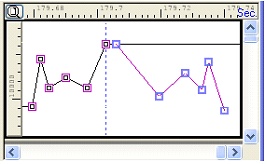
The leftmost picture shows the highlighted points of the diagram fragment being copied to the Clipboard. The second picture shows the insertion with the option "Left Node", the third one - that with additional use of the flag "Symmetrical, horizontal".
In the case when the time span of the diagram fragment being inserted is greater than the time interval of the remaining portion of the diagram to the right of the fixing node (when using left node fixing), or to the left of the fixing node (for right node fixing), the system aborts the insertion operation. This is done to prevent violation of the time segments order.
To add nodes to the selected diagrams at the point of the intersection with the main ruler, that defines the current time instant (highlighted in blue), use the option:
![]() Add Nodes To Selected Diagrams By Time Axis Of The Main Ruler
Add Nodes To Selected Diagrams By Time Axis Of The Main Ruler
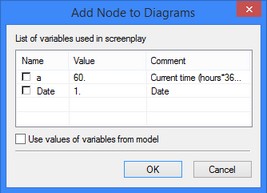
Upon calling the option, a window appears containing the list of variables for each of the existing diagrams.
The column "Value" contains the variable values at the current time instant. Check the variables in the list, whose diagrams are to be added nodes. Upon pressing the [OK] button, new points will be created in the respective diagrams at the point of the intersection with the time main ruler marker. Setting the flag "Use values of variables from model" positions the new nodes along the time main ruler, using the variable values defined for the model. In this case, the new node is connected by straight segments to the neighboring points in the diagram. |
|
This capability allows defining diagrams by modifying variables in the model and then adding nodes with their values at the certain time instant.
Selecting diagram nodes
Point the mouse at the desired node and click ![]() - the point on the diagram will be outlined by a box. Multiple selection is done by one of the following means:
- the point on the diagram will be outlined by a box. Multiple selection is done by one of the following means:
- With the <Shift> key held down, a sequence of nodes is selected between the two specified ones;
- With the <Ctrl> key held down, the directly picked nodes are selected.
Selection of all nodes in the diagram is done by the option:
<Ctrl><A> Select All
The option is called from the context menu over the diagram area.
Box selection of a group of nodes is done with the option turned on:
![]() <S> Select Group Of Diagram Nodes
<S> Select Group Of Diagram Nodes
Deleting diagram nodes
The following option is provided for deleting selected nodes:
![]() <D> Delete Selected Node Or Group Of Nodes
<D> Delete Selected Node Or Group Of Nodes
The option is available under the menu entry "Edit" or from the context menu. Once a node(s) is deleted, the neighboring points in the diagram are connected by straight segment.
Smoothing diagram
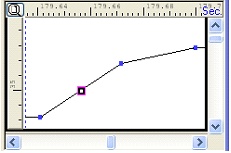
Upon adding new nodes, the diagram is formed as a polyline. If necessary, you can obtain a smooth curve by replacing the polyline segments by curved segments. To do this, point the mouse to the desired segment in the diagram and right click ![]() , and then select the item "Bezier Curve". Two nodes will appear on the selected segments dividing it in equal parts.
, and then select the item "Bezier Curve". Two nodes will appear on the selected segments dividing it in equal parts.
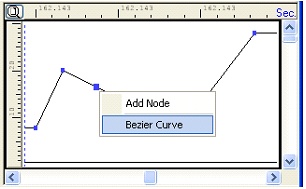
The segment can be transformed into a curve by modifying the position of each node.
The reversed transformation of a curve segment into a straight segment is done by the command "Straighten", available in the context menu upon its selection.
Grid
To apply vertical and/or horizontal ruler lines in the diagram pane for easy orientation in the coordinate space when constructing diagram points, use the option:
![]() Construct Grid Of Rulers In Active Window
Construct Grid Of Rulers In Active Window
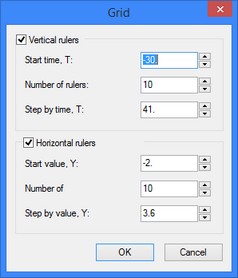
The respective flags in the "Grid" dialog box control the presence of vertical and horizontal rulers. For each type of ruler, the following parameters are defined: Start Time, T. Defines the position of the first ruler; Number of rulers. Defines the number of rulers; Step by time, T. Defines the distance between rulers. To define a ruler crossing at a point with specific coordinates, use the option:
The option is provided under the menu "Edit". To add an individual vertical of horizontal ruler, set the mouse pointer at the image of the scale (time or variable), and click |
|
Driven diagrams
If the model has variables defined by functions or actions, then it is possible to obtain a special type of a diagram – "driven". Since the values of such variables are dependent values, the system creates their diagrams automatically. The lines corresponding to the dependent variables in the list of the animation screenplay dialog box are grayed out. A "driven" diagram cannot be edited; it merely illustrates the variation of the variable during an animation. Note that a driven diagram is regenerated upon starting an animation. This type of a diagram can be used for analyzing mutual positions of various model elements. A variable can be created for this purpose, whose value would be the function of the distance measured between two bodies, vertices, etc. When modifying the model parameters, the diagram of such a variable will reflect changes in the distance concerned.
General animation parameters
Besides the described above, a number of options are available in the toolbar and under the "Edit" menu entry.
![]() <T> Set Limits For Time Scale
<T> Set Limits For Time Scale
This option sets the limits of the Time axis portion visible in the diagram pane.
![]() Change Current Screenplay Name
Change Current Screenplay Name
This option allows saving the current screenplay under a different name and/or change the color of the outlining frame highlighting the active diagram window (the parameter "Active window color").
![]() Save Active Diagram To Text File
Save Active Diagram To Text File
This option allows saving the current diagram or the selected nodes in a text file (*.tfg). In future, the file contents can be inserted into another diagram or another screenplay.
![]() <F7> Update List Of Variables For The Current Model
<F7> Update List Of Variables For The Current Model
This option reloads the changes in the model variable list.
![]() <Alt>+<P> Set Parameters For.avi File
<Alt>+<P> Set Parameters For.avi File
This option allows defining the parameters for recording an .avi file. The parameters are the same as the respective ones in the command "AN: Animate Model".
![]() <Alt>+<A> Set Limits, Step And Delay For Playing Animation
<Alt>+<A> Set Limits, Step And Delay For Playing Animation
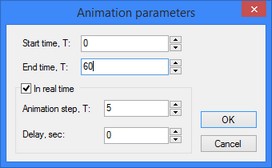
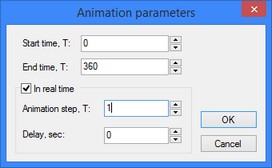
This option defines the values of the following parameters:
Start time, Т. Defines the time instant from which the animation should begin.
End time, Т. Defines the time instant at which animation ends.
In real time. With this flag set, the animation is performed in real time. The latter option means the following. At the beginning, the model is regenerated with the variable values defined for the starting instant of the animation. The next set of values corresponds to the instant when the first model regeneration completes. Therefore, in this case, the animation step is actually the duration required for the model regeneration. |
|
Animation step, Т. Defines the time step for sampling the variable values.
Delay, sec. Defines delay after each step of the animation.
![]() Do Not Use Variable Values From Diagram In Animation
Do Not Use Variable Values From Diagram In Animation
This option allows excluding a variable variation diagram when forming an animation (in this case, the above icon appears before the variable name in the variable list). A repeated call to the option removes the variable diagram block.
Zooming diagram window
When working with the diagram, it is often necessary to change the scale of the diagram image. The listed below options allow manipulating the drawing image in various ways.
![]() <Ctrl>+<T> Zoom In By Time Scale
<Ctrl>+<T> Zoom In By Time Scale
Two points specified by clicking ![]() , define the boundaries of the new interval on the Time scale.
, define the boundaries of the new interval on the Time scale.
![]() <Alt>+<T> Zoom Out Active Window By Time
<Alt>+<T> Zoom Out Active Window By Time
This option results in doubling the current interval on the Time scale.
![]() <Ctrl>+<Y> Zoom In By Values Scale
<Ctrl>+<Y> Zoom In By Values Scale
Two points specified by clicking ![]() define the boundaries of the new interval on the Value scale.
define the boundaries of the new interval on the Value scale.
![]() <Alt>+<Y> Zoom Out Active Window By Values Scale
<Alt>+<Y> Zoom Out Active Window By Values Scale
This option results in doubling the current interval on the Value scale.
![]() <Z> Zoom Window
<Z> Zoom Window
Two points specified by clicking ![]() , define the box diagonal. The vertical and horizontal size of the box area in the window defines the displayed intervals on the Time and Value scales.
, define the box diagonal. The vertical and horizontal size of the box area in the window defines the displayed intervals on the Time and Value scales.
![]() <Ctrl>+<PgUp> Zoom In Active Window
<Ctrl>+<PgUp> Zoom In Active Window
Doubles the current intervals along the Т and Y-axes.
![]() <Ctrl>+<PgDn> Zoom Out Active Window
<Ctrl>+<PgDn> Zoom Out Active Window
Halves the current intervals along the Т and Y-axes.
![]() <Ctrl>+<G> Zoom All Diagram Nodes For Active Window
<Ctrl>+<G> Zoom All Diagram Nodes For Active Window
This option pans/zooms the current window in such a way to fit all the existing diagrams in this window.
Manipulating animation
The following graphical buttons are located in the bottom portion of the animation screenplay dialog box (alternatively, those are accessible under the "Diagram" menu entry or from the context menu, invoked over the list of variables):
![]() <Del> Delete Diagram For Selected Variable
<Del> Delete Diagram For Selected Variable
This option is available for variables with existing diagrams. It deletes the diagram of the current variable.
![]() <Ins> Add Window With Diagram For Selected Variable
<Ins> Add Window With Diagram For Selected Variable
This option is available for variables without diagrams. It creates the variable diagram in a new window.
![]() <P> Apply Current Variable Values For Animation
<P> Apply Current Variable Values For Animation
This option regenerates the T-FLEX CAD model with the variable values per the diagram readings at the current time instant. The current time instant is set using the time ruler (highlighted in blue on the Time scale). As the Time ruler is moved, the variable values are automatically updated in the list.
![]() <A> Animation In T-FLEX CAD On The Current Values Of Variables
<A> Animation In T-FLEX CAD On The Current Values Of Variables
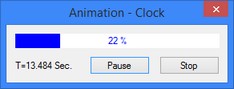
This option starts executing the animation. A sequence of the 3D model (drawing) modifications is displayed, reflecting the model regeneration per the variable values defined in the screenplay. The animation execution is controlled by the buttons [Pause/Continue] and [Stop] in the "Animation" window.
|
|
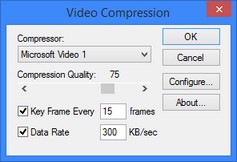
This option is for recording an AVI-file. Upon starting the recording, the system offers to select a compressing application of the video image. The "Video compression" dialog box allows selecting one of the installed applications on your computer and setting its parameters.
This option plays back the recorded AVI-file. |
|
Animation helps visually illustrate the influence of parameter modifications on the shape and/or spatial situation of the objects, model the function of kinematic mechanisms and check permissible ranges of the variable values.
Example: clock ticking animation
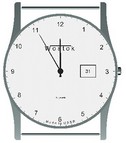
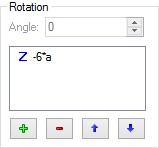
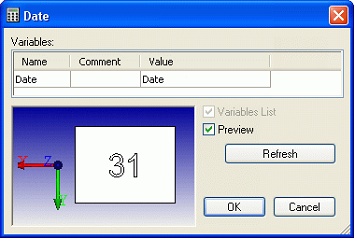
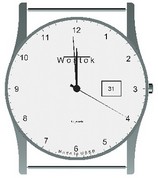
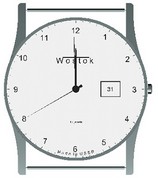
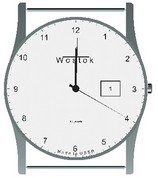
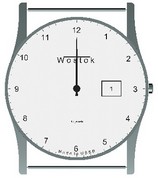
A simple and instructive example of using animation for simulating a mechanism motion can be a model of a clock. This model is provided with the library "Examples", the folder "\2D Design\Animation\Watch\". The model contains an animation screenplay, modeling a working clock: moving arms and changing date. To animate the model, the variables "a" and "Date" are introduced. The variable "a" defines the current time in seconds (it will drive the position of the clock arms), while the "Date" variable – the figure displayed in the date dial of the clock. The clock arms and the date dial are 3D fragments. Since the arms are supposed to rotate in the animation, each arm fragment has an angle parameter defining the angle of rotation with respect to the Z axis via an expression dependent on the variable "a": for the seconds arm it is "-6*a", for the minutes one - "-a/10", and for the hours – "-a/120". The date dial fragment must update the displayed figures during the animation. For this purpose, an external variable "Date" is created in the fragment, defining the numeric figures in the fragment. Upon assembling the fragment, this variable is commanded by its namesake in the assembly. The animation is supposed to simulate the time from 23: 55 to 0:01. During the animation, besides the arms motion, the date shall change on the date dial (at the midnight). Therefore, two independent variables, "a" and "Date", shall vary their values. The model is "animated" by the "Animation Screenplay" application, taking into the account this mentioned feature. |
|
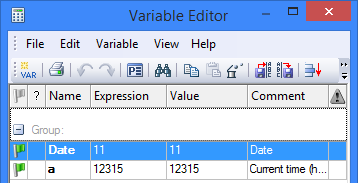
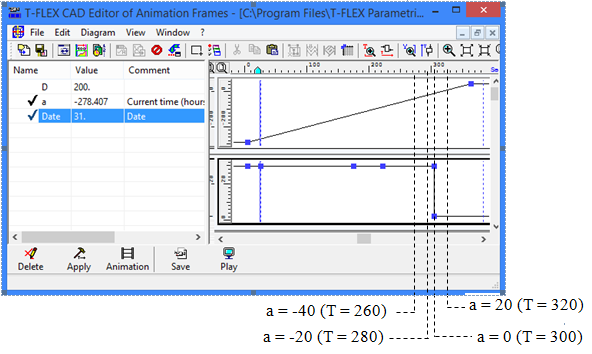
The "Clock" animation screenplay uses the variation diagrams for the variables "a" and "Date". The animation time interval T is assumed from 0 (5 minutes before midnight) to 360(1 minute of the midnight). The time T=300 corresponds to the midnight, that is the moment of changing date. The variable diagrams are created according to the following tabulated values:

The animation parameters define the necessary interval and step of the time variation. The step T=1 corresponds to the clock arms motion with the beat rate of one second.
Now, start running the animation using the option |
|
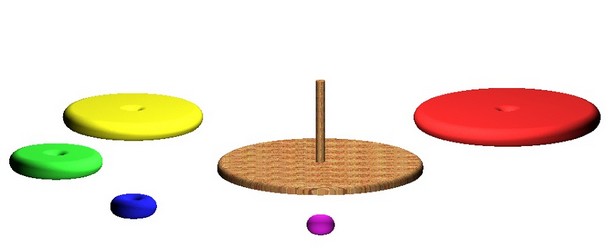
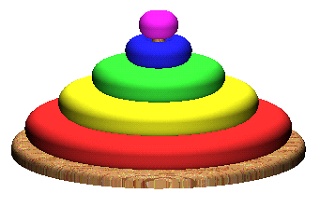
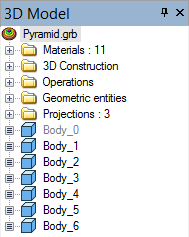
Animation example: disassembling a pyramid
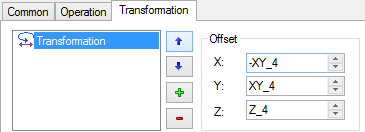
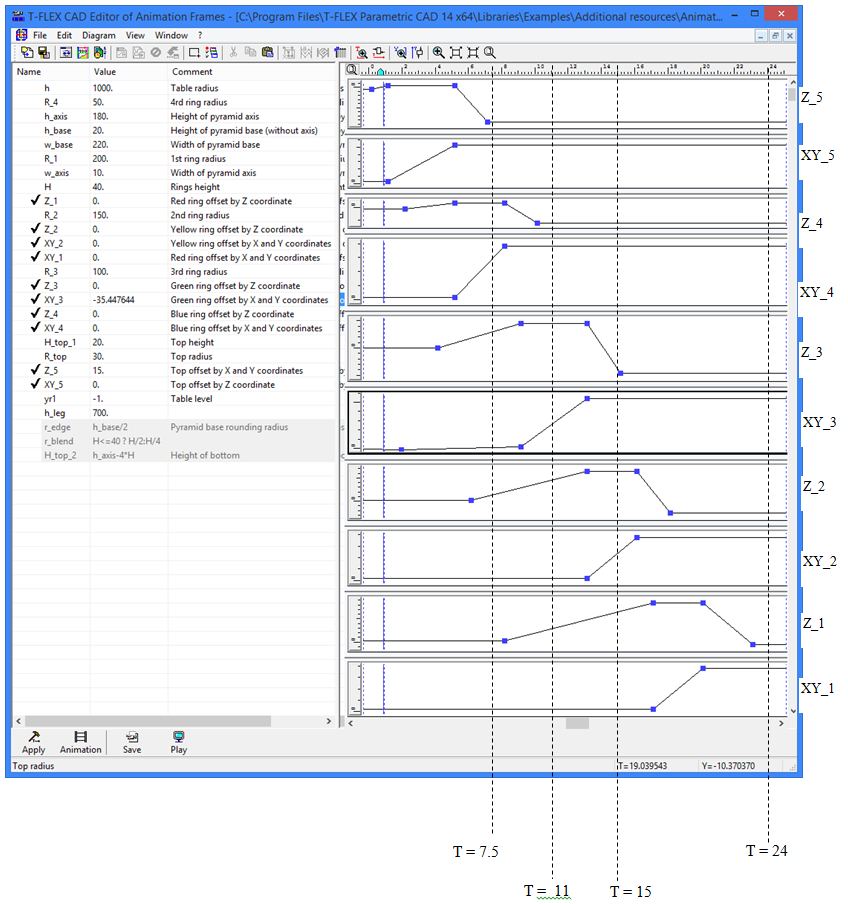
Another example of animation is the animation of taking apart a toy pyramid. The 3D model of the pyramid is located in the library "Examples", the folder "\2D Design\Animation\Pyramid". The model of the pyramid is made of a base with a pole, stacked up four rings, and a topping. When disassembling, the base stays still, while the rings and the topping are "undone" one by one from the base and put around. To achieve this, the shifts from the axes for the respective 3D operations are defined by variable-based parameters. The variables Z_1, Z_2, Z_3, Z_4, Z_5 will define the shifts along the Z-axis, corresponding to the vertical movement of the rings (along the axis of the pole). The variables XY_1, XY_2, XY_3, XY_4 and XY_5 describe the movement of the rings and the topping in the horizontal plane along the X- and Y-axes (removal of the rings off the base). Such a large number of varied variables require use of the "Animation Screenplay" application. Let's define the diagrams for the model variables varying with time in the animation screenplay. Two diagrams correspond to each body being moved (for the topping, those are the diagrams of the variables Z_5 and XY_5, for the blue ring – the diagrams Z_4 and XY_4, etc.). One of those defines the object moving in the vertical plane, the other one - in the horizontal. The diagrams are designed in such a way, that each ring first moves up along the pole (the values of the respective variable Z in the diagram increase). At reaching the top of the pole (the flat portion of the Z variable diagram), a ring starts moving in the horizontal plane at some distance from the base (the growing portion of the respective variable XY diagram), and then goes down (the descending portion of the Z variable diagram). The rings start moving sequentially with the time delay interval of T=2. |
|
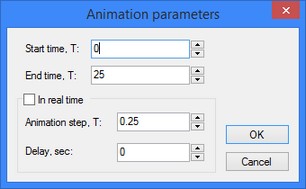
Once all diagrams are created, let's define the animation parameters: the interval T from 0 to 25 (the last ring finishes its movement at the time instant T=23), and the step equal to 0.25.
Upon starting the animation, the process of taking the pyramid apart will be simulated on the screen. The pictures below show certain animation stages corresponding to the time instants shown on the diagrams.
T = 7.25
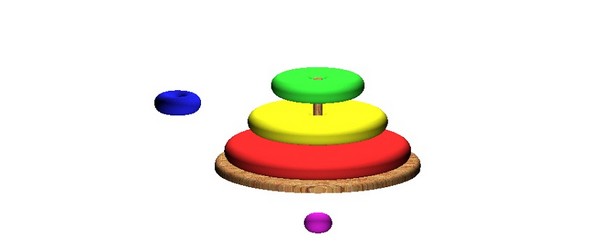
T = 11
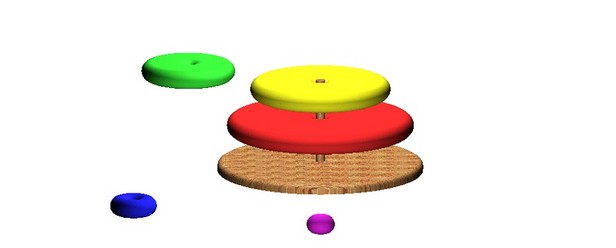
T = 15
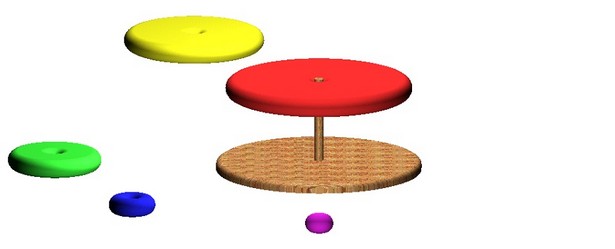
T = 24