Animation Editor |
  
|
Animation Editor |
|
This command is intended for creating animation of 2D drawings and 3D models. Animation allows you to manipulate parameter values and view or write to a file the dynamically changing state of the model. Animation helps visually illustrate the influence of parameter modifications on the shape and/or spatial situation of the objects, model the function of kinematic mechanisms and check permissible ranges of the variable values.
The application is activated using the Customize > Application command.
If the application is running, then its application is called in the same way as any system command is called:
Icon |
Ribbon |
|---|---|
|
Tools > Animation > Animation Editor |
Keyboard |
Textual Menu |
|
Parameters > Animation Editor |
Animation creation is intended for displaying the model when changing the values of its variables. Therefore, the creation of a parametric model is a necessary, but not sufficient condition for creating animation. When designing a drawing or model, the user must assign variables that are responsible for the variable parameters - the geometric shape or position of the elements. Note that the animation screenplay functionality is accessible only when the document has at least one variable that is not a textual (string) variable. A T-FLEX CAD document may contain several animation screenplays, defining the different ways of modifying variables. Upon calling the application, the dialog box is displayed on the screen for entering the name for a new screenplay (New) or selecting an existing one. If an existing screenplay is selected then the provided graphic buttons allow running, recording or reviewing the animation defined by this screenplay, or proceed with editing (Open) or deleting (Delete) the data.
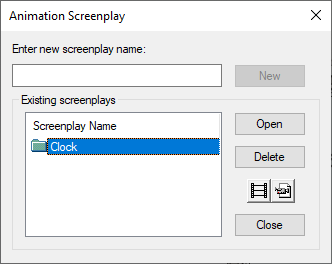
In order to open the Editor of Animation Frames, you need to create a New screenplay or Open one of the Existing screenplays.
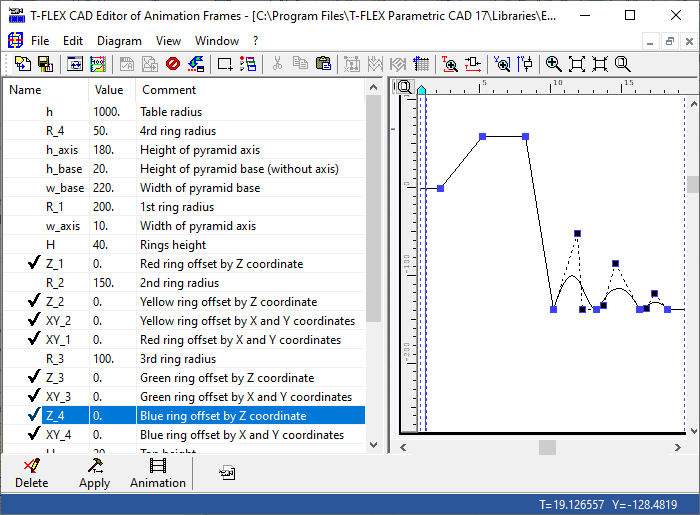
Creation of an animation script provides for the formation of a time dependence of the values of a variable. This dependence is presented in the form of a graph, the coordinate axes of which are the time and the value of the variable. The specified changes in the value of each variable are drawn in the form of a separate graph. In the left part of the window there is a list of model variables, their values and comments. Dependent variables (defined by a function or expression) are marked with a different background (the specifics of working with them will be described below).
What happens when the animation is generated? The system determines the number of animation steps based on the specified range and the value of the animation time increment. Then, sequentially, for each step, the values of the variables are read from the plotted graphs and the model is recalculated with the current set of parameters.
Creating new diagram
Click ![]() the desired line in the variable list, and then select the following option in the Diagram section of main menu or in the bottom toolbar:
the desired line in the variable list, and then select the following option in the Diagram section of main menu or in the bottom toolbar:
|
<Ins> |
Add... |
This option, as well as some other options described below, is also available in the contextual menu of selected element.
The Diagram parameters dialog box will appear next.
In future, you can call this dialog again for modifying the specified values, using the Properties... option in the Diagram section of the main menu or following option in the top toolbar:
|
<C> |
Diagram Properties |
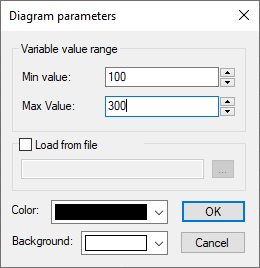
The Diagram parameters dialog contains following parameters:
•Variable value range (Min value, Max value)
Defines limits of the displayed variable value range. By default range is set from 0,5 to 1,5 of the current value.
•Load from file
Upon enabling the checkbox you can click the [...] button and select a *.tfg file. A Diagram will be loaded from the selected file. If there's a diagram already created in the current document, it will be replaced by a diagram from the selected file
•Color
Color of the diagram line.
•Background
Color of the diagram background.
Upon confirming the diagram parameters, it's pane opens. The ruler on the left side of the diagram pane represents the scale for the variable values, while the one on the top side of the diagram pane reflects the time scale. Both scales reflect the defined range is of the values (the default time interval is from 0 to 60 seconds). At the beginning, the variable diagram is a constant equal to the current variable value. The user can now add an arbitrary number of points, defining the variation of the variable values along the specified time interval. If the screenplay already has another variable diagram in the window, then upon selecting a variable, the following option becomes available in the Diagram section of the main menu and in the top toolbar:
|
<G> |
Add Diagram To Active Window... |
The current window is outlined by a frame, whose color is defined by the parameter Active window color in the Screenplay Properties dialog. This dialog can be invoked using the Screenplay... option in the File section of the main menu or following option in the top toolbar:
|
|
Screenplay Name... |
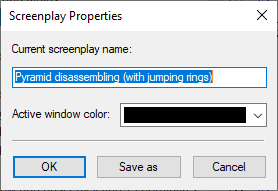
This option invokes dialog, where you can change Active window color and Current screenplay name. Clicking OK after changing the name renames the current scenario. Clicking Save as after changing the name saves a copy of the current scenario under the new name.
To select the current window, point the mouse to the desired diagram and click ![]() . The option of adding a variable to the current window allows overlapping several diagrams in one coordinate space. If several diagrams are present in one window, the last modified diagram is considered selected. Its line is thicker, and the respective entry is highlighted in the list of a variables. A diagram sharing the window with other diagrams can be moved to a separate window using the following option in the Diagram section of the main menu and in the top toolbar:
. The option of adding a variable to the current window allows overlapping several diagrams in one coordinate space. If several diagrams are present in one window, the last modified diagram is considered selected. Its line is thicker, and the respective entry is highlighted in the list of a variables. A diagram sharing the window with other diagrams can be moved to a separate window using the following option in the Diagram section of the main menu and in the top toolbar:
|
|
New Window |
Adding/modifying diagram points
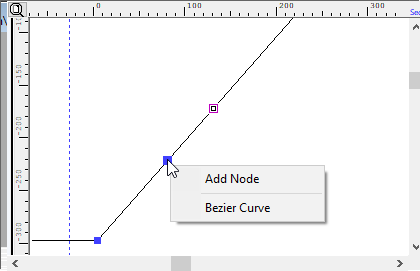
As the pointer moves inside the diagram window, its current coordinates are displayed in the lower right corner. Upon clicking ![]() , a new node is created under the pointer position, and is connected by straight segments with the neighboring points in the diagram. To create a new node dividing an existing segment of the diagram in the two, point the mouse to the diagram line and select the item Add Node from the context menu.
, a new node is created under the pointer position, and is connected by straight segments with the neighboring points in the diagram. To create a new node dividing an existing segment of the diagram in the two, point the mouse to the diagram line and select the item Add Node from the context menu.
To modify the node position, point the mouse to it (the mouse pointer will change its appearance). Then, dragging the mouse with the ![]() depressed, place this node of the diagram in a different position. To specify the exact node coordinates, right click
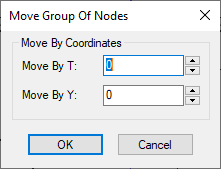
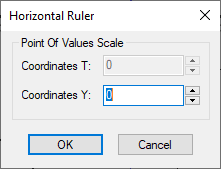
depressed, place this node of the diagram in a different position. To specify the exact node coordinates, right click ![]() , select in the coming up automenu the item Properties and enter the values for the Т- and Y-coordinate. In the case of multiple selection of the nodes in the diagram, the selected group of points can be translated using the Move... option in the Edit > Diagram section of the main menu or the following option in the top toolbar:
, select in the coming up automenu the item Properties and enter the values for the Т- and Y-coordinate. In the case of multiple selection of the nodes in the diagram, the selected group of points can be translated using the Move... option in the Edit > Diagram section of the main menu or the following option in the top toolbar:
|
<М> |
Transfer |
Upon selecting this option, a dialog box appears for inputting the shift values along the Т and Y axes. As a result, the selected group of points will change its position per the specified values.
Using the clipboard
Adding points to a diagram can also be done using the following options in the Edit section of the main menu or in the top toolbar:
|
<Ctrl>+<X> |
Cut |
|
<Ctrl>+<C> |
Copy |
|
<Ctrl>+<V> |
Paste |
Use of these options implies existence of least one diagram with two nodes. Select several nodes (those will be highlighted) and pick one of the options, Cut or Copy, in the control toolbar. Then select the fixing node for inserting the selected fragment of the diagram and pick the option Paste. Thereafter, the Insertion dialog box appears.
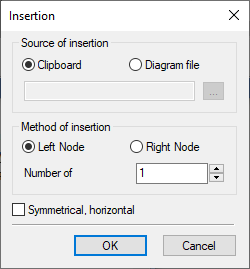
Besides the Clipboard, a source for insertion can be a diagram saved in a file (*.tfg). The insertion particulars are defined by the fixing node of the diagram fragment being inserted (Left Node, Right Node) and by the number of insertions. If the flag Symmetrical, horizontal is set, then the insertion fragment will be a copy of the original mirrored about the vertical line passing through the fixing node.
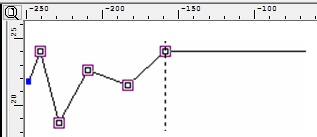
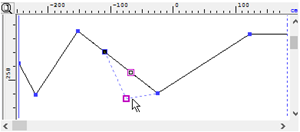
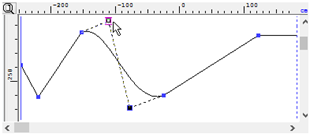
The leftmost picture shows the highlighted points of the diagram fragment being copied to the Clipboard. The second picture shows the insertion with the option Left Node, the third one - that with additional use of the flag Symmetrical, horizontal.
In the case when the time span of the diagram fragment being inserted is greater than the time interval of the remaining portion of the diagram to the right of the fixing node (when using left node fixing), or to the left of the fixing node (for right node fixing), the system aborts the insertion operation. This is done to prevent violation of the time segments order.
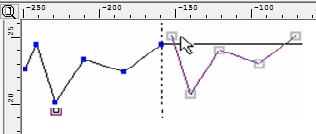
To add nodes to the selected diagrams at the point of the intersection with the main ruler, that defines the current time instant (highlighted in blue), use the following option in the Edit > Diagram section of the main menu or in the top toolbar:
|
|
Add Nodes... |
Upon calling the option, a window appears containing the list of variables for each of the existing diagrams:
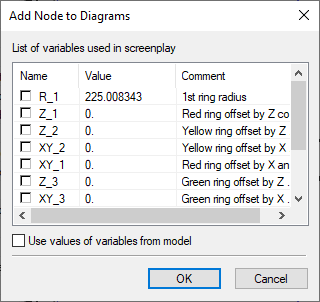
The column Value contains the variable values at the current time instant. Check the variables in the list, whose diagrams are to be added nodes. Upon pressing the OK button, new points will be created in the respective diagrams at the point of the intersection with the time main ruler marker. Setting the flag Use values of variables from model positions the new nodes along the time main ruler, using the variable values defined for the model. In this case, the new node is connected by straight segments to the neighboring points in the diagram.
This capability allows defining diagrams by modifying variables in the model and then adding nodes with their values at the certain time instant.
Selecting diagram nodes
Point the mouse at the desired node and click ![]() - the point on the diagram will be outlined by a box. Multiple selection is done by one of the following means:
- the point on the diagram will be outlined by a box. Multiple selection is done by one of the following means:
•With the <Shift> key held down, a sequence of nodes is selected between the two specified ones;
•With the <Ctrl> key held down, the directly picked nodes are selected.
Selection of all nodes in the diagram is done using the following option in the Edit section of the main menu:
|
<Ctrl>+<A> |
Select All |
Box selection of a group of nodes is done using the Selector option in the contextual menu of diagram window or the following option in the top toolbar:
|
<S> |
Select Nodes |
Deleting diagram nodes
The Delete option in the Edit section of the main menu and the following option in the top toolbar can be used for deleting selected nodes:
|
<D> |
Delete Node(s) |
Once a node(s) is deleted, the neighboring points in the diagram are connected by straight segment.
Smoothing diagram
Upon adding new nodes, the diagram is formed as a polyline. If necessary, you can obtain a smooth curve by replacing the polyline segments by curved segments. To do this, point the mouse to the desired segment in the diagram and right click ![]() , and then select the item Bezier Curve. Two nodes will appear on the selected segments dividing it in equal parts.
, and then select the item Bezier Curve. Two nodes will appear on the selected segments dividing it in equal parts.
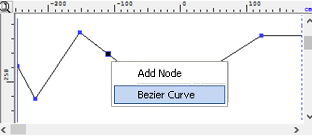
The segment can be transformed into a curve by modifying the position of each node.
The reversed transformation of a curve segment into a straight segment is done by the command Straighten, available in the context menu upon its selection.
Grid
To apply vertical and/or horizontal ruler lines in the diagram pane for easy orientation in the coordinate space when constructing diagram points, use the Rulers grid... option in the View section of the main menu or the following option in the top toolbar:
|
<Ctrl>+<R> |
Grid |
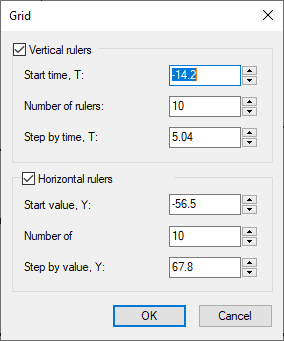
The respective flags in the Grid dialog box control the presence of vertical and horizontal rulers. For each type of ruler, the following parameters are defined:
•Start Time or Start Value
Defines the position of the first ruler;
•Number of rulers
Defines the number of rulers;
•Step by time or Step by value
Defines the distance between rulers.
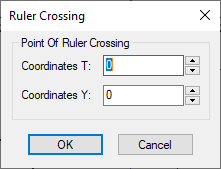
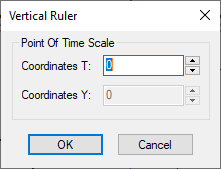
To define a ruler crossing at a point with specific coordinates, use the following option in the Edit section of the main menu:
|
<R> |
Rulers crossing... |
To add an individual vertical of horizontal ruler, set the mouse pointer at the image of the scale (time or variable), and click ![]() . In the coming up menu select the item Ruler and specify the point on the scale, for the ruler being created to pass through.
. In the coming up menu select the item Ruler and specify the point on the scale, for the ruler being created to pass through.
Driven diagrams
If the model has variables defined by functions or actions, then it is possible to obtain a special type of a diagram – driven. Since the values of such variables are dependent values, the system creates their diagrams automatically. The lines corresponding to the dependent variables in the list of the animation screenplay dialog box are grayed out. A "driven" diagram cannot be edited; it merely illustrates the variation of the variable during an animation. Note that a driven diagram is regenerated upon starting an animation. This type of a diagram can be used for analyzing mutual positions of various model elements. A variable can be created for this purpose, whose value would be the function of the distance measured between two bodies, vertices, etc (see the Measure command). When modifying the model parameters, the diagram of such a variable will reflect changes in the distance concerned.
General animation parameters
Besides the described above, a number of options are available in the top toolbar and in the Edit section of the main menu:
|
<T> |
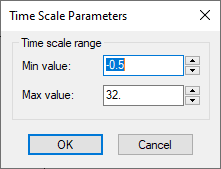
Time Scale |
This option sets the limits of the Time axis portion visible in the diagram pane.
|
<Ctrl>+<S> |
Save Diagram |
This option allows saving the current diagram or the selected nodes in a *.tfg file. In future, the file contents can be inserted into another diagram or another screenplay.
|
<F7> |
Update List |
Reloads the changes in the model variable list.
|
<Alt>+<A> |
Animation Parameters |
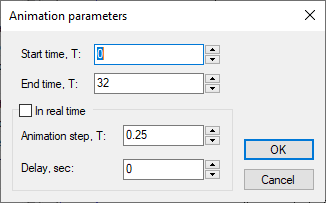
Invokes the dialog box, where you can defines the values of the following parameters:
•Start time
The time instant from which the animation should begin.
•End time
The time instant at which animation ends.
•In real time
With this flag set, the animation is performed in real time. The latter option means the following. At the beginning, the model is regenerated with the variable values defined for the starting instant of the animation. The next set of values corresponds to the instant when the first model regeneration completes. Therefore, in this case, the animation step is actually the duration required for the model regeneration.
•Animation step
The time step for sampling the variable values.
•Delay
Delay after each step of the animation.
|
|
Block Diagram |
This option allows excluding a variable variation diagram when forming an animation (in this case, the above icon appears before the variable name in the variable list). A repeated call to the option removes the variable diagram block.
Zooming diagram window
When working with the diagram, it is often necessary to change the scale of the diagram image. The listed below options allow manipulating the drawing image in various ways.
|
<Ctrl>+<T> |
Zoom In By T |
Two points specified by clicking ![]() , define the boundaries of the new interval on the Time scale.
, define the boundaries of the new interval on the Time scale.
|
<Alt>+<T> |
Zoom Out By T |
This option results in doubling the current interval on the Time scale.
|
<Ctrl>+<Y> |
Zoom In By Y |
Two points specified by clicking ![]() , define the boundaries of the new interval on the Value scale.
, define the boundaries of the new interval on the Value scale.
|
<Alt>+<Y> |
Zoom Out By Y |
This option results in doubling the current interval on the Value scale.
|
<Z> |
Zoom Window |
Two points specified by clicking ![]() , define the box diagonal. The vertical and horizontal size of the box area in the window defines the displayed intervals on the Time and Value scales.
, define the box diagonal. The vertical and horizontal size of the box area in the window defines the displayed intervals on the Time and Value scales.
|
<Ctrl>+<PgUp> |
Zoom In |
Doubles the current intervals along the Т and Y-axes.
|
<Ctrl>+<PgDn> |
Zoom Out |
Halves the current intervals along the Т and Y-axes.
|
<Ctrl>+<G> |
Zoom All Diagrams |
This option pans/zooms the current window in such a way to fit all the existing diagrams in this window.
Manipulating animation
The following graphical buttons are located in the bottom toolbar as well as in the Diagram section of the main menu and in the contextual menu of the list of variables:
|
<Del> |
Delete |
This option is available for variables with existing diagrams. It deletes the diagram of the current variable.
|
<Ins> |
Add |
This option is available for variables without diagrams. It creates the variable diagram in a new window.
|
<P> |
Apply |
This option regenerates the T-FLEX CAD model with the variable values per the diagram readings at the current time instant. The current time instant is set using the time ruler (highlighted in blue on the Time scale). As the Time ruler is moved, the variable values are automatically updated in the list.
|
<A> |
Animation |
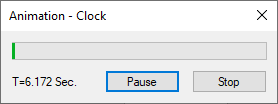
This option starts executing the animation. A sequence of the 3D model (drawing) modifications is displayed, reflecting the model regeneration per the variable values defined in the screenplay. The animation execution is controlled by the buttons Pause/Continue and Stop in the Animation window.
|
<F> |
Save To *.avi |
This option is for recording an *.avi or *.wmv file. Upon starting the recording, the system offers to select a compressing application of the video image. The "Video compression" dialog box allows selecting one of the installed applications on your computer and setting its parameters.