Drawing Creation


Drawing Creation |
|
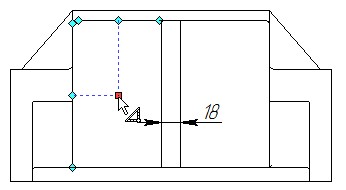
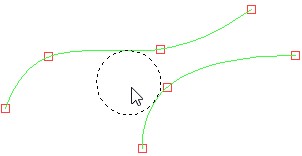
To improve the user experience, a new binding mechanism has been implemented. If one of the drawing commands is active, then when you hover the cursor on the object in the scene, its characteristic points are highlighted. These points can be used to associate dimensions and notations, or to create new drawing elements.
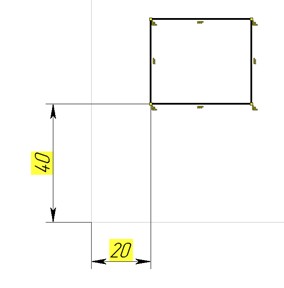
For example, the mechanism allows to create a new element relative to the center of rectangle.
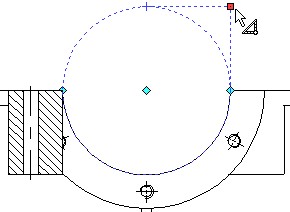
In the same way, you can get a snap to the characteristic points of the circle.
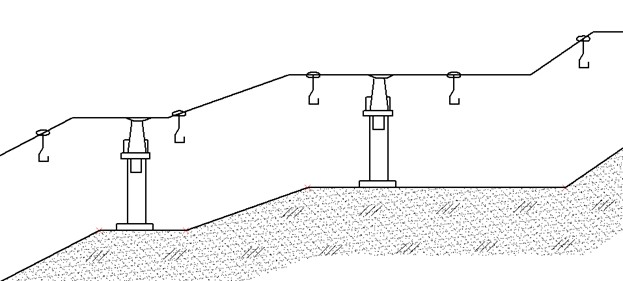
A new mode of snapping to 3D elements allows you to create profiles using snaps to nodes and vertices of the 3D model.
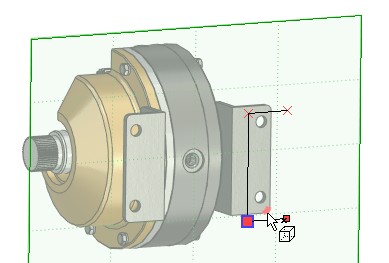
The snap is active if a special filter ![]() is enabled.
is enabled.
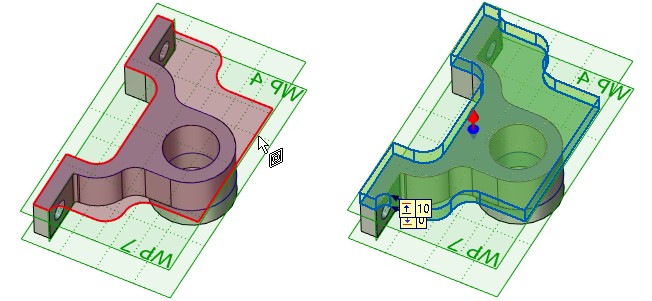
The Auxiliary line option was added to the lines parameters.
Now when performing command Draw on Face the face projection lines are displayed as auxiliary ones. You can not create a profile on the basis of auxiliary lines. But they can be converted to normal lines.
To create a profile, you need to select the necessary lines and remove the Auxiliary line flag in their parameters, or select an option from the context menu.
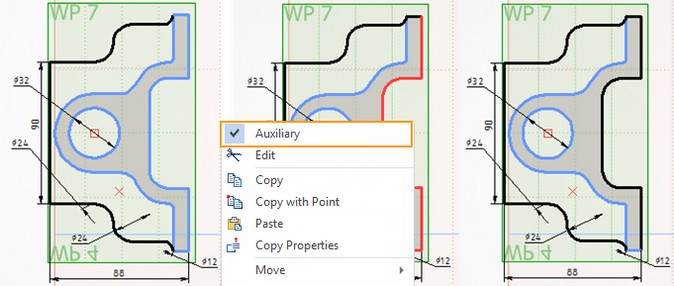
Auxiliary lines will become normal lines and can be used for the profile creation.
In addition, auxiliary lines can be used to snap new elements to them.
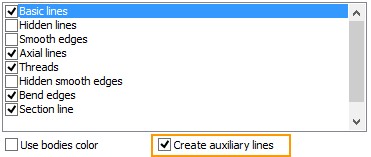
If necessary, when creating a projection, you can manually set the Create auxiliary lines flag and then all lines on the created projection will become auxiliary.
When you draw on the face of the body, this flag is set automatically.
Auxiliary lines can be hidden on the drawing in the Hide construction mode.
To switch the type of lines from normal to auxiliary, it is convenient to use special options in the context menu. They allow you to quickly switch the type of individual lines or all selected lines.
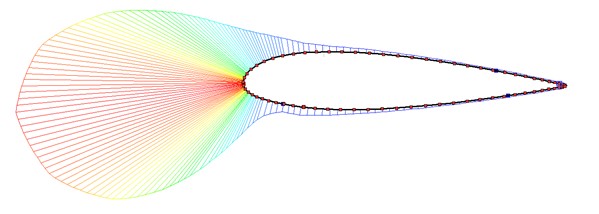
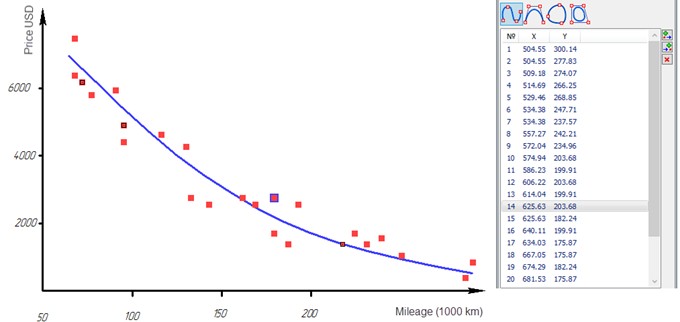
The option of spline creation in the Sketch command is substantially refined. The spline is constructed as a smooth curve without approximation by segments.
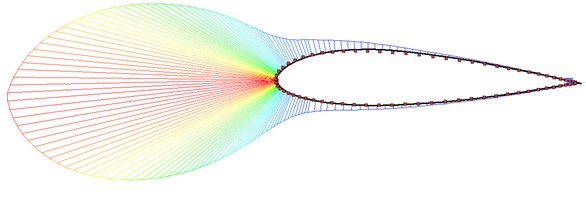
The smoothness of the diagram depends on the given tolerance.
value 0.0001
value 0.01
The general scenario of work was extended with:
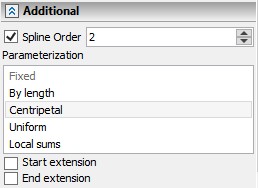
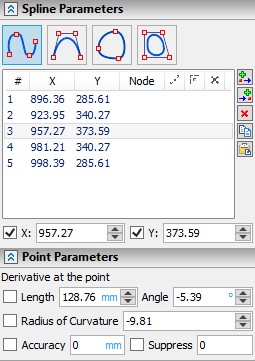
●The ability to switch the spline type is added;
●The modes for creation of closed and non-closed polyline are added;
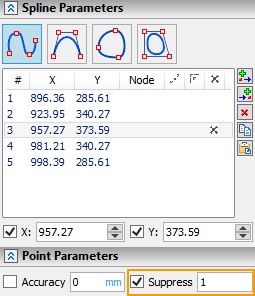
●The list of points was added to the parameters window. The list can be edited;
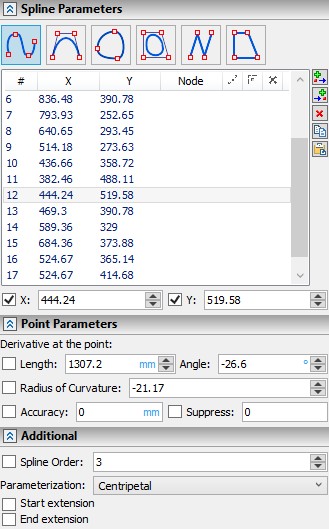
●Coordinates, snapping to nodes, boundary conditions, tolerance and suppression mode are displayed in the points list;
●The ability to transparently add new spline points and automatically set dimensions for spline points was added;
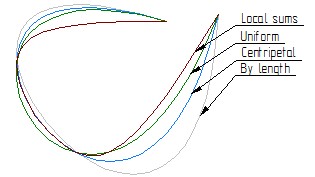
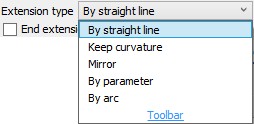
●Several new spline parameterization methods have been implemented;
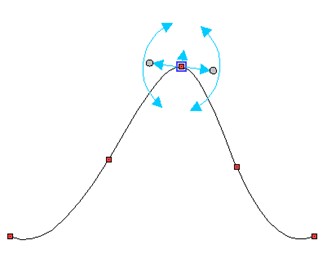
●Possibility to control boundary conditions using draggers including intermediate points of the spline was added ;
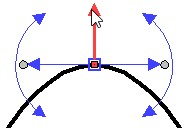
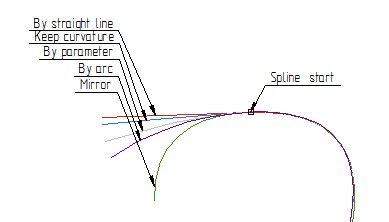
●Possibility to control of elongation/shortening of the spline using different methods is realized.
●Possibility to create approximating splines with a given tolerance using the Accuracy parameter was added. Tolerance is specified for the entire spline, i.e. cannot be different for different points. This solves the problem of creating a smooth spline over a large array of points.
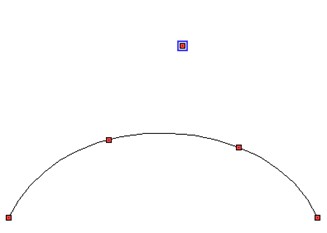
●Possibility to suppress individual spline points using the Suppress parameter was added. You can use variables or expressions to control the supression.
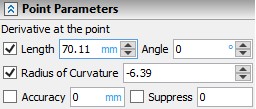
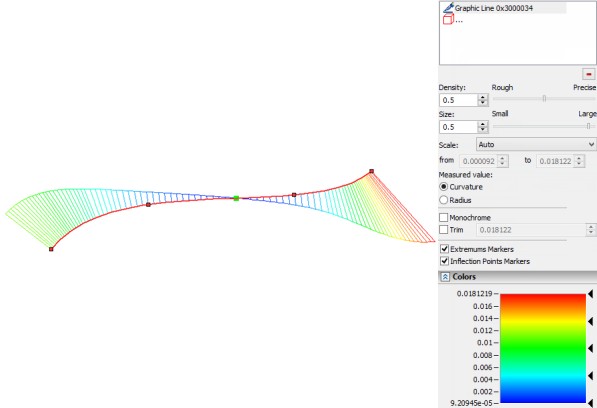
●Possibility to display the curvature of the curve using the context menu command Show curvature and control properties of this diagram was added for splines.
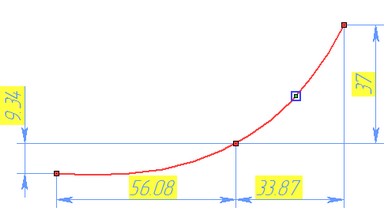
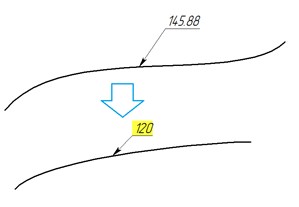
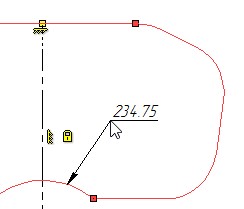
There is an opportunity to control the length of the spline with the help of the leader dimension.
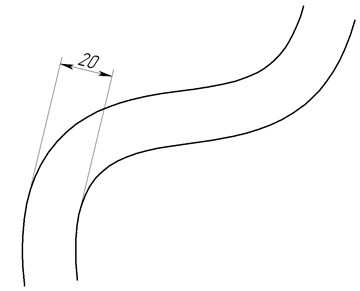
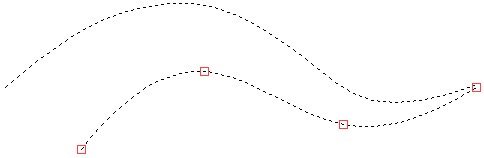
You can set constraints on other elements of the drawing. For example, when using constraints, it is easy to construct splines that are tangent and smoothly conjugate to each other or to other drawing lines.
A new type of 2D array Array by curve was added. It allows you to place copies of image lines along the selected path with the ability to control the orientation of the copies.
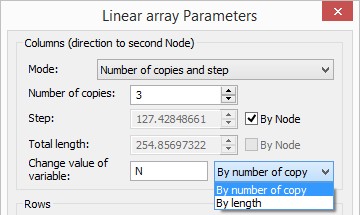
For linear and circular arrays, the ability to control variables during the generation of copies was added. To do this, the parameter Change value of variable was added to the parameters of the arrays. The variable takes a value either according to the copy number (By number of copy mode), or according to the distance from the start of the trajectory or according to the angle value (By Length mode for linear arrays, By Angle mode for circular arrays).
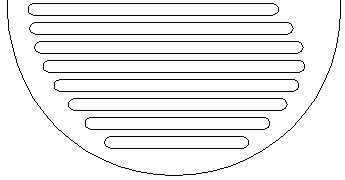
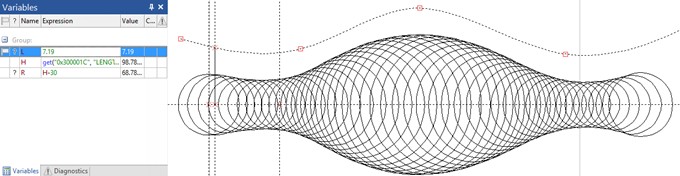
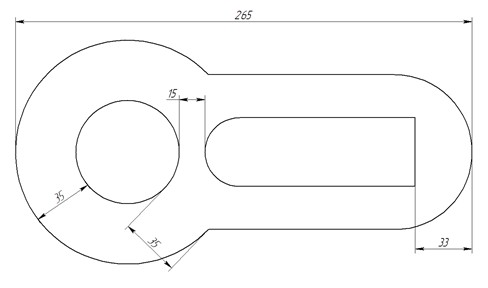
Example of a linear array: the diameter of the circle is obtained by measuring the length of the secant line, which measures the distance to the spline.
A possibility to create dimensions between circles and straight lines/arbitrary curves was added.
Added the ability to create dimension between equidistant curves
Now the leader dimension measures the length of the element on which it is created (graphic lines, sketch lines). You can select additional elements to create a leader dimension, after which the total length of all selected elements will be displayed.
The possibility to bind the dimension to the zero point of the page was added. For example, this allows you to fix points that do not need to change their position when changing the rest of the drawing.
Now it is possible to create dimensions based on wire geometry (3D paths, 3D profiles, 3D axes).
Control elements that simplify leader notes creation were added.
The control elements allow you to enter a name on the shelf of the leader note and create new jogs. A marker that allows you to change the direction of the jogs in leader notes/callouts with several jogs was added.
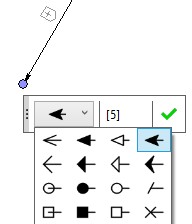
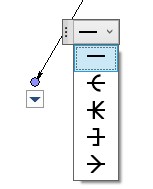
Markers for creating text on the jog line, selecting the arrows for the leader note and setting the symbol were added.
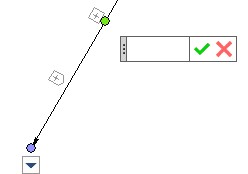
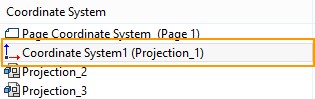
The possibility to create custom 2D local coordinate systems was added. LCS exists only for a particular page.
User can create drawings relative to his own LCS, which will allow the entire created drawing to be moved while moving the LCS.
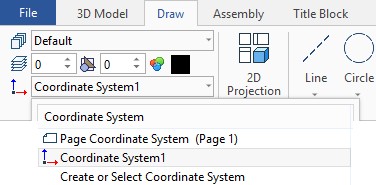
You can create a LCS using the Create LCS ![]() command on the Ribbon.
command on the Ribbon.
You can select the active LCS, according to which all the elements will be created, from the special list.
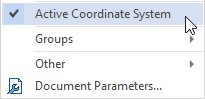
The active coordinate system is drawn by thick lines on the drawing.

The coordinates of all created and edited objects will be recalculated according to the active coordinate system.
You can also select the corresponding item from the LCS context menu.
The coordinates of the 2D elements given relative to the coordinate system will be recalculated taking into account its position.
It is also convenient to bind 2D LCS to the projection. This allows you to create drawings directly on the projection.
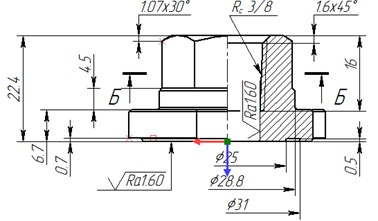
In this case, drawings that are created manually will move along with the projection. To do this, select a projection in the drop-down list and the associated LCS will be created.
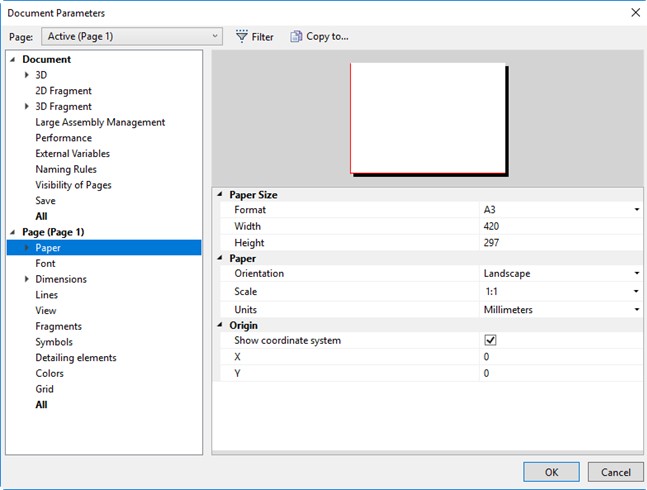
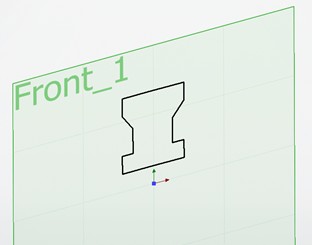
The Show coordinate system option is added to the document parameters. When it is turned on, a page coordinate system is displayed on the drawing. This option is useful for the work with sketch editor, as it allows you to see the start point of the page, which may be used for snapping. The option is available for both drawing pages and workplanes. This, in turn, helps to control the workplane orientation in space when drawing on it. The coordinate system cannot be drawn in the hidden construction lines mode, it cannot be printed out and it cannot be exported to external formats.
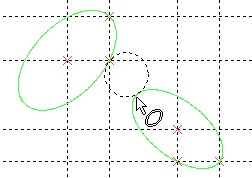
New Types of Tangent Circles
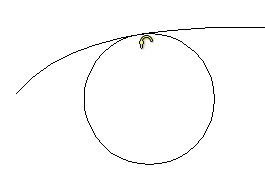
New types of tangent circles were added.
A circle tangent to two splines.
A circle tangent to a spline and an ellipse.
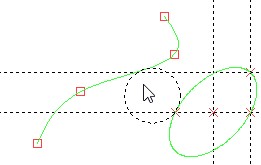
A circle tangent to two ellipses.
New Options for Creating Offset Curve
New options were added to the TO: Create Offset Curve.
Corners handling option was added.
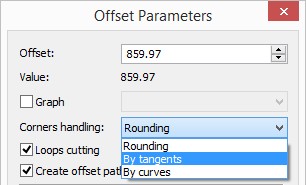
By default Rounding is created.
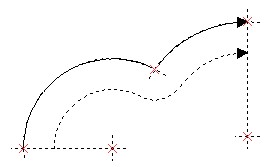
By tangents type was added.
By curves type was added.
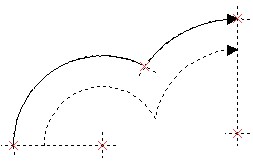
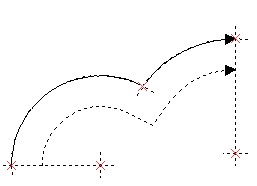
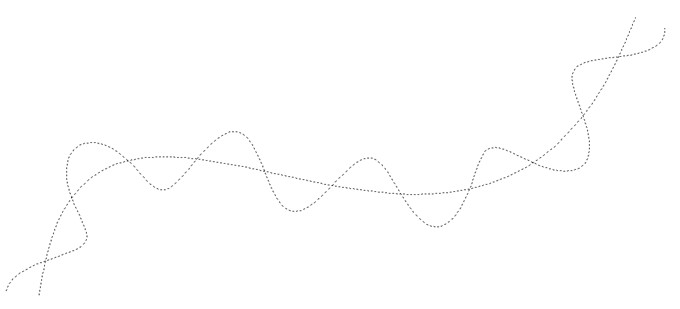
The offset curve can be constructed with a variable offset, which is specified by the graph. You should specify "Smooth curve" type for the graph.
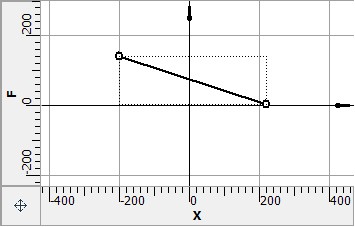
Then you should select the graph in the parameters of the offset curve.
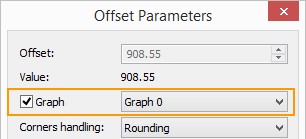
The distance to the offset curve will be calculated according to the graph.
Example of creating an offset curve to a spline using the graph of a function constructed using the cosine formula:
Accuracy of Splines and Ellipses Calculation Increased.
Now calculation of splines and ellipses is more accurate. Previously, they were calculated using polyline and had an error.
Now the spline is created by points. The node on the spline will be located without error. This is seen with a strong zoom-in.
The Project Elements command, which allows you to additionally project 3D-model elements onto the active workplane or another working surface type, has been updated. Now, instead of creating or editing a projection, the command creates separate lines constructed on the base of workplane and the projected 3D-element. At the same time, the operation interface has been greatly simplified. To control the types of projected elements, the buttons on filter panel are used.
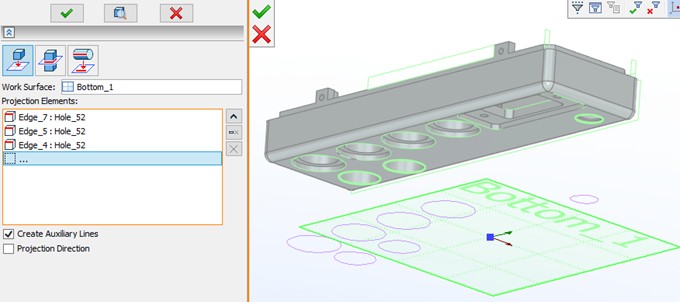
The command supports 3 operation modes:
●Projection to workplane
●Intersections with workplane
●Projection of elements outline edges to workplane
The last 2 modes provide a completely new functionality for T-FLEX CAD.
Depending on the set option, the command is able to create either auxiliary or basic lines, which can be used for further snapping of lines in the sketch editor or in other commands.
The Projection Direction option allows you to additionally specify the direction of elements projection. If it is off, the projection is performed along the normal to the specified working plane.
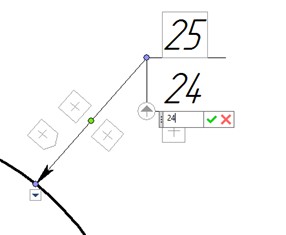
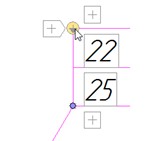
Increase and Decrease of Font Size
The commands Enlarge Font Size and Reduce Font Size have been added to the View toolbar. They change the default font size, as well as the default arrows size for the active page, according to a set of standard font sizes. |
|