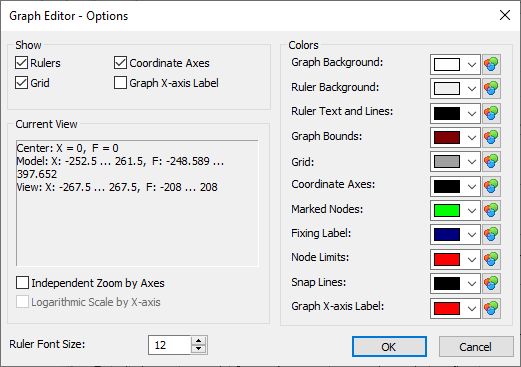
Options of Graph Editor |
  
|
The graph editor options dialog can be called using the following command:
![]() <Ctrl>+<O> Options
<Ctrl>+<O> Options
The dialog contains following controls to set up the graph editor appearance.

The Show group of options contains the switches to enable/disable auxiliary utility objects – the ruler, the automatically scalable coordinate grid, coordinate axes, the argument marker.
The pane in the Current View group of options displays the coordinates of the displayed area for the user reference.
The flag Independent Zoom by Axes controls the mode of independent scaling along the axes. If it is turned on, then upon scaling with the help of the ruler the visual scale factor along the X-axis changes independently of the scale along the Y-axis.
The flag Logarithmic Scale by Argument Axes is a reference flag and is always unavailable for editing. This flag shows what argument scale is set in the properties of the graph being edited.
In the right part of the dialog there is a group of controls to set up the colors of various objects in the graph editor.
With the help of the parameter Ruler Font Size you can also define the font size for the graph editor ruler.