Using Graphs in 3D Operations |
  
|
Graphs can be used for a more intuitive way of defining tabular dependencies in some 3D modeling commands. For example, in the Blend Edge command – to define the law of changing a variable radius, in the Sweep operation – to define the law of changing the twist angle or scaling of the contour or in the Transition Surface operation to control the discriminant value. It can be used wherever you need to define the law of changing some operation's parameter over a certain range, whose length is defined in percent (0%-100%).
To define a dependency by a graph, use the special Graph button in the operation properties window, next to the field for defining the entries of tabular dependencies or a value entry field. Upon clicking the button, the graph editor opens, in which there is already a graph constructed based on the input data. (By default, those are the point positions 0% and 100% with the respective parameters.) The graph type in this case is always a smooth curve.
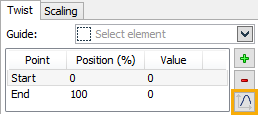
Depending on the operation type, we can distribute various properties using a graph. The definition range and the graph values range are also limited depending on the operation type. The range of values allowed for input in the X-axis is always from 0 to 100. This defies the position of each point. In the Y-axis we reckon the operation parameter values for each point. For example, for a variable round blend, one can define the law of the radius distribution along the span of the selected edges. In this case, the system will not allow setting the function value less than zero, since this is restricted in the blend operation.
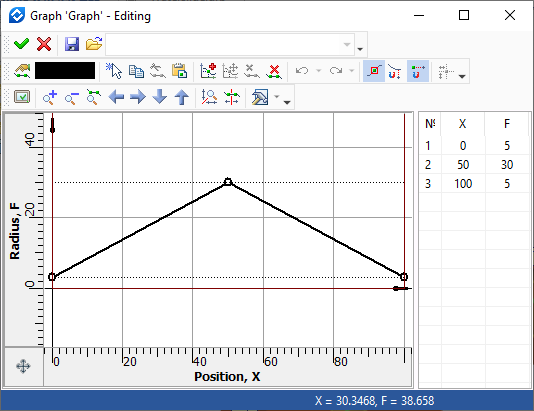
The result is shown below:
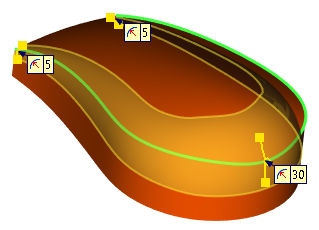
To save the results of editing a graph, exit the editor by clicking the button ![]() . After closing the editor, the system will transfer all graph points to the properties window to display the dependencies in the tabular form.
. After closing the editor, the system will transfer all graph points to the properties window to display the dependencies in the tabular form.
In some operations (for example, Transition Surface), it is possible to create a dependency graph with the ability to customize its type, axis type and units of measurement without entering the graph manager. By connecting such a graph, you can control, for example, the magnitude of the continuation of the surface or the radius of the arc, thereby making these values not constant. To do this, in the required operation, click the Add Graph graph button.


If any graph already exists in the model, then it can be selected from the Use Existing Graph.
Existing graphs are also displayed in the dialog of the Graphs command.
Graph types Polyline and Cubic Spline are used for linear parameter variation and cubic variation law. At each point of a cubic spline, the parameters of the tangent angle and the scale of the tangent vector are available: this makes it possible to describe with high accuracy any mathematical or empirical dependence.
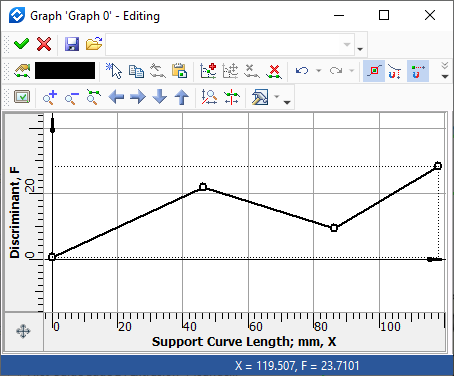
Graph type - Polyline
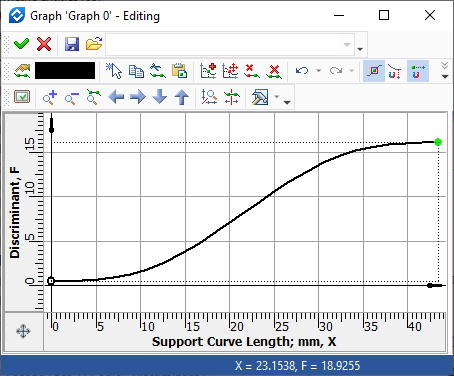
Graph type - Cubic Spline
If you select the option of the graph type By 3D Curve, then in the case of a transition surface - the discriminant, the system will offer to additionally select two curves in the 3D scene.
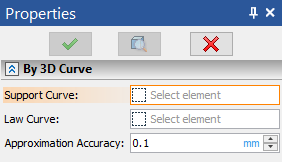
The first one will define the X-axis: Support Curve. The second, Law Curve, will determine the distance from the reference curve, thereby setting the value of the function.
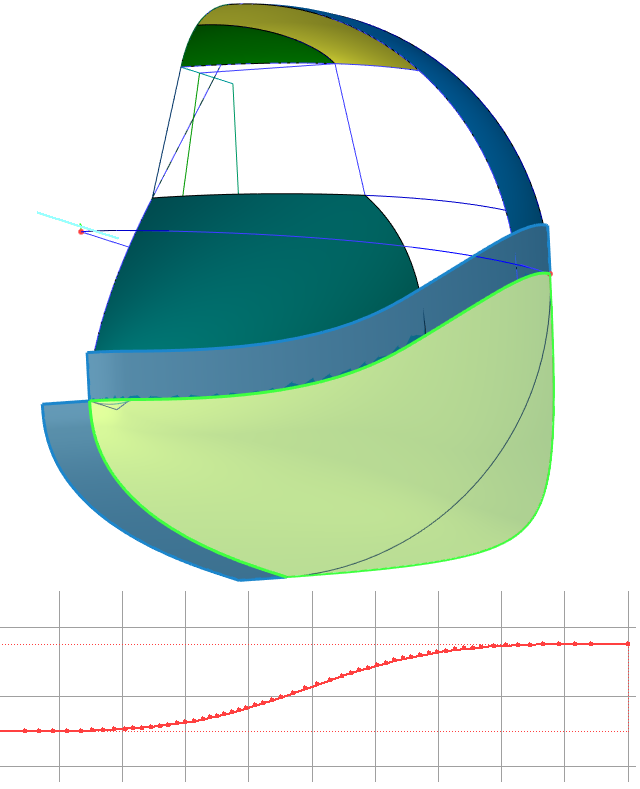
The dialog for creating a graph also allows you to define the type of value along the X axis and the unit of measurement for length, if the option for the X axis is selected as length.