Commands of Graph Editor |
  
|
The graph editor has three bars with various tools and icons to launch utility commands.
The Standard toolbar looks like this:
![]()
It contains:
•Commands to close the graph editor with or without saving changes:
![]() Save changes and close
Save changes and close
![]() Cancel changes and close
Cancel changes and close
![]() <Ctrl>+<S> Save to File (allows you to save the edited graph in *.tflaw format)
<Ctrl>+<S> Save to File (allows you to save the edited graph in *.tflaw format)
![]() <Ctrl>+<L> Load to File (allows you to save the edited graph in *.tflaw format allows you to replace the edited graph with another graph from an external *.tflaw file. As a result of the command execution, all starting points are deleted, and the main properties are replaced by others)
<Ctrl>+<L> Load to File (allows you to save the edited graph in *.tflaw format allows you to replace the edited graph with another graph from an external *.tflaw file. As a result of the command execution, all starting points are deleted, and the main properties are replaced by others)
•A drop-down list to select the name of the graph being edited is used when several graphs are edited simultaneously.

The Edit toolbar looks like this:
![]()
It contains:
•An icon to call the edited graph properties dialog:
![]() <Ctrl>+<P> Graph Properties
<Ctrl>+<P> Graph Properties
•A drop-down list (combo box) to define the colors of the graph line:
![]() Graph Color
Graph Color
•Commands to work with the clipboard:
![]() <Ctrl>+<A> Select all nodes
<Ctrl>+<A> Select all nodes
![]() <Ctrl>+<C> Copy
<Ctrl>+<C> Copy
![]() <Ctrl>+<X> Cut
<Ctrl>+<X> Cut
![]() <Ctrl>+<V> Paste
<Ctrl>+<V> Paste
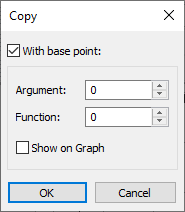
To copy graph points to the clipboard, you first need to select points in the table of coordinates or in the workspace. Next, you can use the command Copy or Cut. When copying graph points, the system must remember the reference point for future snapping when pasting from the clipboard.
To define the point, the Copy… dialog window appears. The user can define the coordinates of the reference point or select it on the graph. To select a point in the workspace, you need to enable the option Show on Graph and click OK. Next, the system goes into the mode of waiting for point selection. The respective help message appears at the bottom of the graph editor in the status bar line. The user can point at any location in the workspace or select any of the existing graph points. If the user did not specify a reference point, the system will use the origin instead.

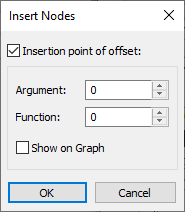
When adding the copied points from the clipboard to the graph, the system will prompt for defining the target point to snap the insertion to. The Insert Nodes dialog window will appear. In it you can also define the coordinates of the insertion target point or enable the mode of selecting such point in the workspace. If the user did not define the reference point at the time of copying, then, when defining the coordinates for the insertion, the user will thus define the offsets of the new graph points from the original position. When specifying the target point, the preview image of new graph points rubberbands with the cursor.

•Commands to work with graph nodes:
![]() <Ctrl>+<N> Add new Node by Coordinates
<Ctrl>+<N> Add new Node by Coordinates
![]() <Ctrl>+<E> Edit Node Coordinates
<Ctrl>+<E> Edit Node Coordinates
![]() <Del> Delete Selected Nodes
<Del> Delete Selected Nodes
![]() <Ctrl>+<Shift>+<Del> Delete All Nodes
<Ctrl>+<Shift>+<Del> Delete All Nodes
•Commands to undo unwanted actions and redo undone actions:
![]() <Alt>+<BackSpace> Undo
<Alt>+<BackSpace> Undo
![]() <Ctrl>+<BackSpace> Redo
<Ctrl>+<BackSpace> Redo
•Options to enable the modes of selecting nodes and object snapping:
![]() Mark / Select nodes
Mark / Select nodes
![]() Snap to Nearest Point
Snap to Nearest Point
![]() Snap to Nearest Node
Snap to Nearest Node
![]() <Ctrl> Move Nodes by Coordinate Axes
<Ctrl> Move Nodes by Coordinate Axes
The View toolbar look like this:
![]()
It contains:
•The command to refresh the image:
![]() <F7> Update Window
<F7> Update Window
•Commands to zoom in and out the image:
![]() <Ctrl>+<Shift>+<PageUp> Zoom In
<Ctrl>+<Shift>+<PageUp> Zoom In
![]() <Ctrl>+<Shift>+<PageDown> Zoom Out
<Ctrl>+<Shift>+<PageDown> Zoom Out
•The command to automatically fit the entire image within the workspace window bounds:
![]() <Ctrl>+<Shift>+<End> Zoom All
<Ctrl>+<Shift>+<End> Zoom All
•Commands to pan (move) the image:
![]() <Ctrl>+<Shift>+<Left> Left
<Ctrl>+<Shift>+<Left> Left
![]() <Ctrl>+<Shift>+<Right> Right
<Ctrl>+<Shift>+<Right> Right
![]() <Ctrl>+<Shift>+<Down> Down
<Ctrl>+<Shift>+<Down> Down
![]() <Ctrl>+<Shift>+<Up> Up
<Ctrl>+<Shift>+<Up> Up
•The button to enable the mode of separate zooming by axes:
![]() Zoom separately by axes
Zoom separately by axes
•The command to enable/disable the mode when a special vertical marker is displayed that reads the argument position and returns the respective function value. This command is duplicated with a special switch flag in the graph editor options (see below):
![]() Argument Marker
Argument Marker
•An icon to call the graph editor options dialog (see options description below):
![]() <Ctrl>+<O> Options
<Ctrl>+<O> Options
The drop down list, which pops up upon pressing the symbol ![]() to the right of the button, allows the user to customize the view of the graph editor window (display of the toolbars, rulers, grid, etc.).
to the right of the button, allows the user to customize the view of the graph editor window (display of the toolbars, rulers, grid, etc.).