Graph Editor |
  
|
Graphs are edited in a special graph editor. The editor is called by selecting the desired graph in the Graphs window and clicking the Edit… button, or by double-clicking on the graph's row. To simultaneously edit several graphs, select them into graphs manager using <Shift> and use the Edit… button as well. All graphs will be simultaneously displayed in the editor. At the same time, one of them will be active and editable. To switch between graphs, use the interface control (the drop-down list) with graph names.
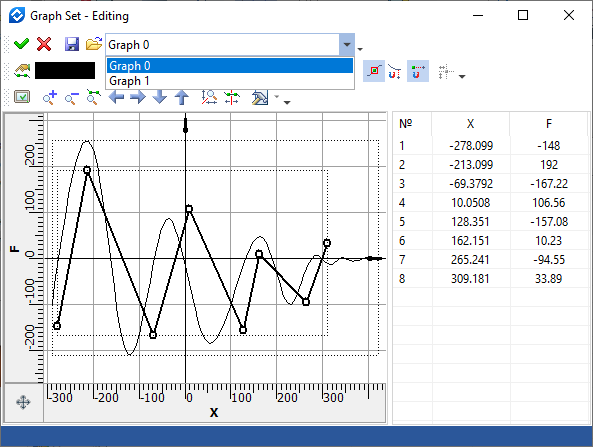
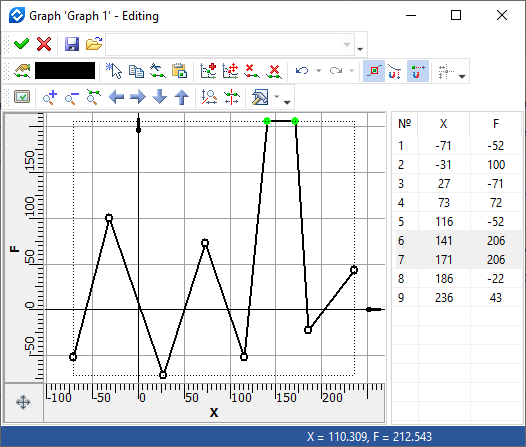
The main portion of the editor window is occupied by the workspace, in which graphs are displayed. The workspace is ruled for convenience with an automatically scalable coordinate grid. Image moving (panning) and scaling (zooming) is done by the mouse wheel – in the same way as when drawing in T-FLEX CAD.
The coordinate rulers are displayed along the borders of the workspace. You can use these rulers in the same way as in the T-FLEX CAD drawing window – to pan and zoom the image. The graph editor allows separate zooming along the coordinate axes. Separate zooming is done using a ruler, when the appropriate mode is enabled in the graph properties, or by the ![]() icon on the editor's View toolbar. A specified ratio of coordinate axes units is automatically stored in the graph properties.
icon on the editor's View toolbar. A specified ratio of coordinate axes units is automatically stored in the graph properties.
Clicking ![]() in the workspace creates a new graph point. All points are connected by a line (curve) of the specified type (a polyline or a spline). For user convenience, the current cursor position coordinates are displayed in the status bar in the lower-right corner of the graph editor.
in the workspace creates a new graph point. All points are connected by a line (curve) of the specified type (a polyline or a spline). For user convenience, the current cursor position coordinates are displayed in the status bar in the lower-right corner of the graph editor.
At the right of the workspace there is the table of graph point coordinates. Point coordinates can be edited directly in this table. You can start editing coordinates after double-clicking ![]()
![]() in the desired table cell. To input changes, press <Enter> or switch the input focus to another window. The edited (selected) graph point is highlighted. To select several points, use the keys <Shift> or <Ctrl>.
in the desired table cell. To input changes, press <Enter> or switch the input focus to another window. The edited (selected) graph point is highlighted. To select several points, use the keys <Shift> or <Ctrl>.
A graph point position can be modified with the cursor, by grabbing the point with ![]() and dragging it to the new position. When double-clicking
and dragging it to the new position. When double-clicking ![]()
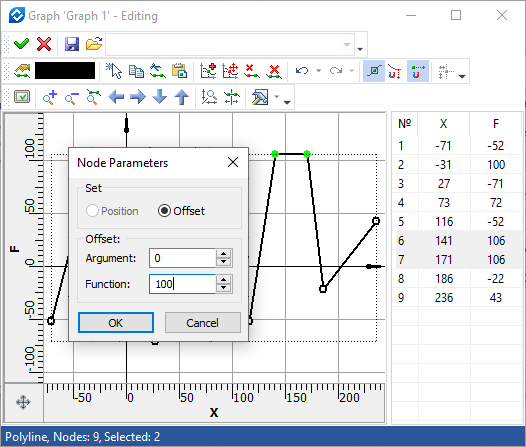
![]() on a graph point, a special dialog appears to edit point coordinates. Here you can enter the absolute point coordinates (when switched to position) or set offset coordinates with respect to the current point position (when switched to offset). If, when double-clicking
on a graph point, a special dialog appears to edit point coordinates. Here you can enter the absolute point coordinates (when switched to position) or set offset coordinates with respect to the current point position (when switched to offset). If, when double-clicking ![]()
![]() , several points were preselected (for example, in the table of coordinates), then only the offsets can be used. This is convenient, if you need to move a segment of the graph by a certain distance (see an example below).
, several points were preselected (for example, in the table of coordinates), then only the offsets can be used. This is convenient, if you need to move a segment of the graph by a certain distance (see an example below).
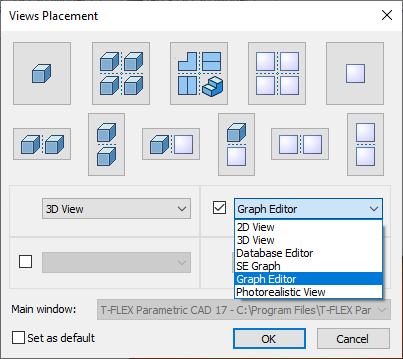
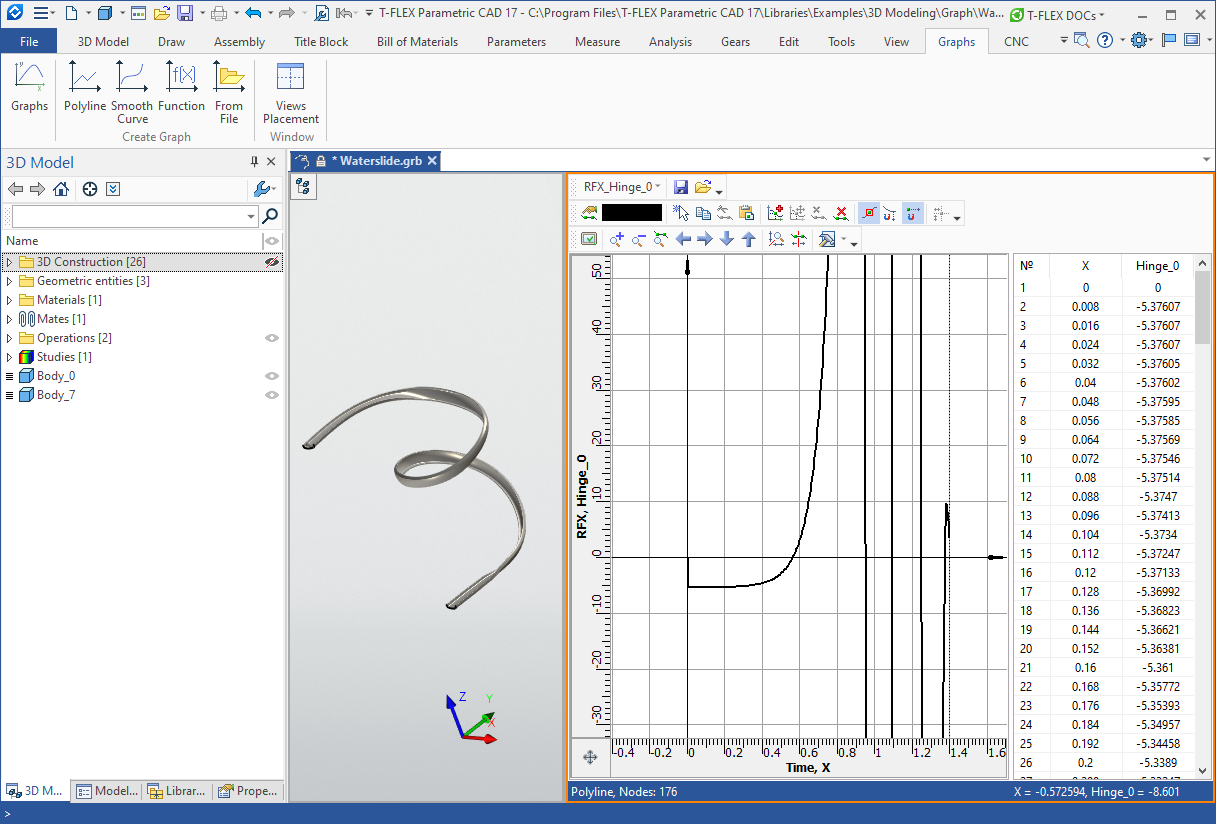
Using the command Views Placement, the graph editor can be placed in a separate document window. When working with a graph, a special Graph ribbon tab will be automatically activated.
