Graph Properties |
  
|
A dialog with descriptive and defining graph properties can be accessed by clicking the Properties… button in the list of graphs.

The graph name and type are displayed in the upper part. You can edit the graph name. The graph type is defined at creation and is not changed later.
You can define the following graph properties in the Units parameters group:
•The labels for the graph's coordinate axes – in the fields Argument Axis Title and Function Axis Title;
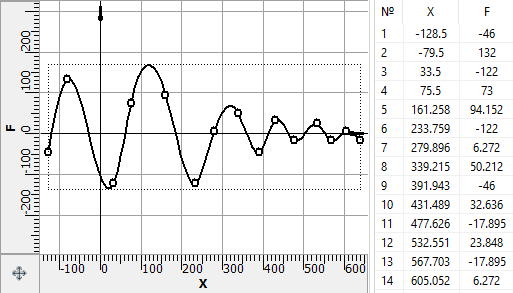
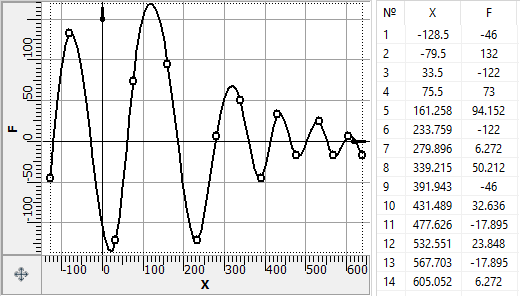
•The Function/Argument Scale Factor parameter defines the units scale along one axis relative to another one when plotting the graph. It is used to setup the image when individual axis scales need to be used. The graph editor can set this value automatically (see below);

Function/Argument Scale Factor = 1

Function/Argument Scale Factor = 2
•The Minimal Argument Step parameter determines the minimum allowed distance between two neighboring nodes of the graph in the X-direction.
The Current Limits group of parameters displays the information regarding the current graph bounds. You can also deliberately impose graph limits by the argument and by the function. When limits are enabled, the system will not allow creating points out of the limit bounds. By default, limits are not imposed.
The Boundary Conditions group of parameters defines the conditions for the ends of the graph line. Such parameters can be used only for the "smooth curve" graph type. You can define the tangent of the curve direction slope at the graph start and end. You can also set equalities of first and second derivatives at the graph start and end. Such boundary condition allows obtaining a smooth transition between copies when having a master graph segment repeated cyclically.
The Return Closest Functions Value for Arguments out of Graph Limits flag serves to use the graph for any argument values, including those outside the existing defining range. This parameter is used to work with the function graph("GRAPH NAME", ARGUMENT VALUE) of the variables editor.
The Read Only Mode flag prohibits modifying properties and coordinates of graph points.
The Show Nodes flag enables the display of function nodes on the graph.
The Show Limits flag turns on graphic rendering of the range-of-definition bounds and the values range (actual) for the given graph. Graph bounds are displayed as a dotted frame.
The flag Logarithmic Argument Scale sets the logarithmic scale along the argument axis of the graph.
The Auto Repeat group of parameters defines a cyclic repeating of a master graph segment in both directions. When repeating in the positive direction, then each copy of the master segment is attached by its start point at the end point of the graph, and vice versa when in the negative direction.