Debugging, Compiling and Running Macros |
  
|
Compiling project
To start compilation, use the following option:
Macro Editor |
||
|---|---|---|
Icon |
Keyboard |
Textual Menu |
|
<Ctrl>+<F7> |
Project > Compile |
Compiling the project is a necessary action before running the macro for execution. During compilation, the system analyzes the macro code and identifies errors. Any errors found are displayed in the Output window.
Compilation errors occur when the system cannot interpret the entered text. These errors can be caused by incorrect syntax of the statement or by setting the wrong method or property.
Output window
The Output window is located at the bottom of the macro editor. It serves for displaying messages about the current state of the project. Errors and warnings resulting from project compilation are displayed in this window.

An error message displayed in this window contains information about the error location in the code window (line and column number) and the error number.
To jump to an error location in the code window, you can either double-click ![]()
![]() or call the option Go To Error from the context menu accessible by right clicking
or call the option Go To Error from the context menu accessible by right clicking ![]() .
.
The error type and information about the error can be found in the Microsoft Developer Network (MSDN) application development guide by the code displayed within the error message in the Output window.

Upon a successful project compilation, the macro will be added into T-FLEX CAD Macros window and can be executed thereafter.
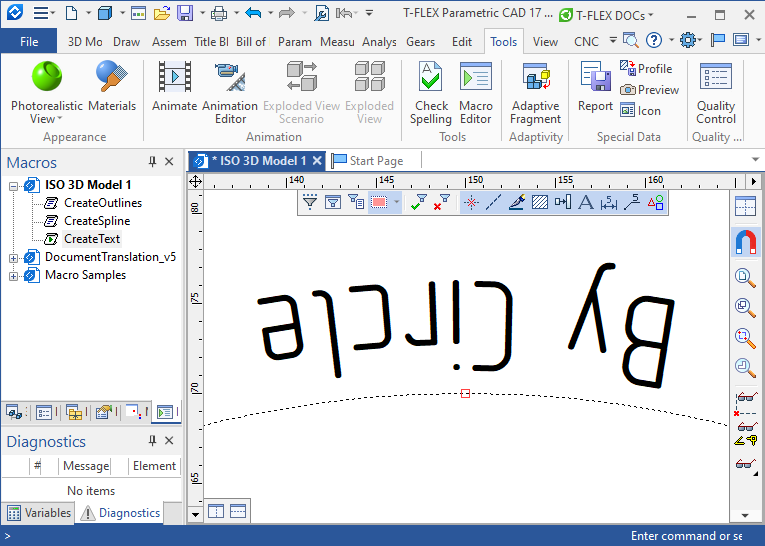
The figure below shows the result of running a macro that creates a construction line - a circle and line text fixed to this circle. The code for this macro was given above when describing the module code window.

Macros debugging. Breakpoints
If, after running the macro for execution, it becomes obvious that the macro does not work correctly, you can use the macro debug mode to detect code errors.
In debug mode, the macro is compiled (if necessary) and then launched for execution with the possibility of stopping at intermediate points - breakpoints. At the moment of stopping, you can check the current states of the macro objects using the Quick Watch command.
Setting up breakpoints
You can create a breakpoint using the Breakpoint command:
Macro Editor |
||
|---|---|---|
Icon |
Keyboard |
Textual Menu |
|
<F9> |
Debug > Breakpoint |
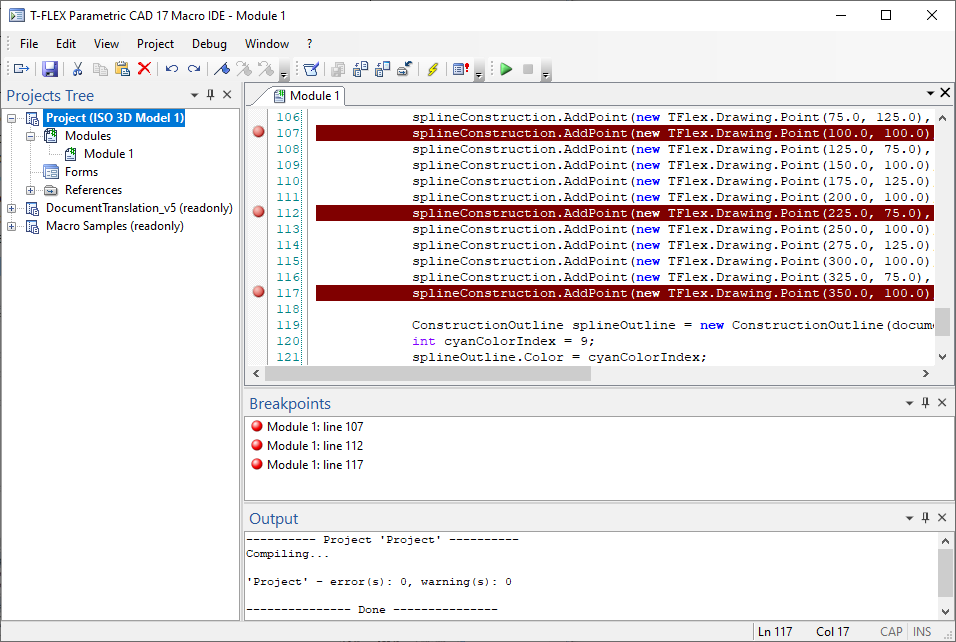
The breakpoint is assigned to the line of code where the cursor was at the time the command was invoked. That is, to create a breakpoint, you need to position the cursor on the line of code before which you need to stop the execution of the macro, and press <F9> (or call the command in another way). The breakpoint mark ![]() will appear in the label area to the left of the selected line of code, and the line itself will be highlighted. To create another breakpoint, you need to position the cursor on the next line and call the Breakpoint command again, etc.
will appear in the label area to the left of the selected line of code, and the line itself will be highlighted. To create another breakpoint, you need to position the cursor on the next line and call the Breakpoint command again, etc.
A list of all assigned breakpoints is displayed in the Breakpoints window.

To delete a breakpoint, just position the cursor on the line with the breakpoint and re-call the command - Breakpoint.
Running macros
You can start debugging a macro using the following command:
Macro Editor |
||
|---|---|---|
Icon |
Keyboard |
Textual Menu |
|
<F5> |
Debug > Start Debug |
Since a module can contain multiple macros (procedures), you need to tell the system which procedure to run. To do this, you need to select the default method (macro) in the command Project Properties.
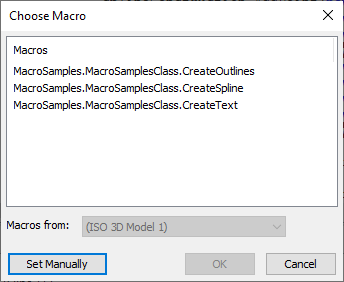
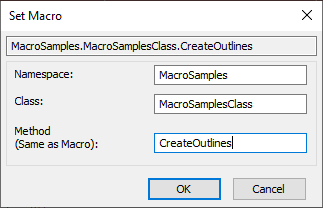
If the method was not specified initially, the Choose Macro dialog appears, letting you to select the method to be run by default. In this dialog, you can select any desired method from the list provided for the current project, or click the button Set Manually and type in the method manually in the coming up Set Macro dialog: defining the namespace, the class and the name of the procedure to be run.


After choosing a method, it will be launched. If the module code has been changed since the last compilation, the system will offer to recompile the project before starting the debug mode.
Working in debug mode
Once started, the macro runs until the first breakpoint in the code and stops. The execution of the macro is passed to the macro editor in the line with the code going up to the breakpoint. The main T-FLEX CAD window becomes inactive. At this moment, you can call the Quick Watch command:
Macro Editor |
||
|---|---|---|
Icon |
Keyboard |
Textual Menu |
|
<Ctrl>+<Alt>+<Q> |
Debug > Quick Watch |
This command allows you to check the value of any code object at the time of the macro stop. An object can be either system type (string, integer, real, etc.) or user-defined.
You can resume the execution of the macro (until the next breakpoint) by calling the Start Debug command again. To fully execute the macro, this command will have to be called as many times as there are breakpoints in the code.
To quickly terminate the macro (without stopping at breakpoints), use the Stop Debug command:
Macro Editor |
||
|---|---|---|
Icon |
Keyboard |
Textual Menu |
|
|
Debug > Stop Debug |