Normal Deviation |
  
|
Normal Deviation |
|
Calling the command:
Icon |
Ribbon |
|---|---|
|
Measure> Geometry Analysis > Normal Deviation |
Keyboard |
Textual Menu |
<QN> |
Tools > Geometry Analysis > Normal Deviation |
This command allows measuring deviation of the normals on the adjacent faces at the selected edges.
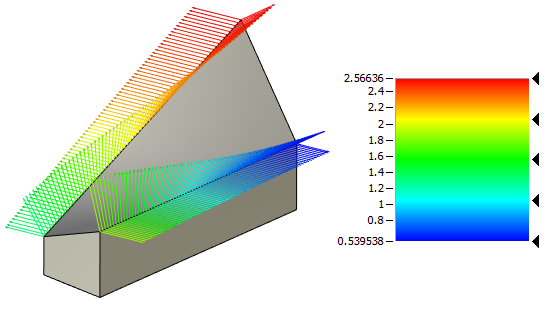
The quills displayed in the 3D window allow viewing deviation of normals across the extent of an edge. You can also measure the angle of normal's deviation at a specific point.
Upon entering the command, you need to specify edges, at which you need to measure the deviation of normals. To select all edges belonging to a certain face, use the option:
|
<F> |
Add/Remove selected Face |
To select a specific edge, use the option:
|
<E> |
Select Edge or cancel Edge selection |
Upon selecting an edge, a plot diagram is displayed reflecting differences between the normal directions. The quill color varies according to the color scale defined on the Colors tab. Working with this tab is same as in the Curve Curvature command.
Depending on the difference in the face normals, the length of the plot lines may vary as well as the color. The way in which the length changes depending on the angle difference is defined by the Length parameter.
The length of a plot's lines can be proportional to the angle, inversely proportional to the angle, or constant.

To measure normals' deviation angle at a specific point on an edge, use the option:
|
<C> |
Measure deviation at point |
If you click on a certain point of the edge, a label will be created with the value of the angle at that point.

Working with the Results tab is done same as in the Curve Curvature command.